Hb Electrophoresis: Essentials and How to Read It
The normal hemoglobins, the methods in use, a reading routine, the thalassemia and sickle patterns, and seven cases.
These slides are an outline only. Read the notes under each slide below with them, and chapter 6 of the Hematology Handbook. This lecture builds on the hemoglobin electrophoresis slides in The Clinical Approach to Anemia, Part 3.
Hb electrophoresis
These slides are an outline only. Read the notes under each slide on this page with them, and chapter 6 of the Hematology Handbook. This lecture builds on the hemoglobin electrophoresis slides in The Clinical Approach to Anemia, Part 3.
This lecture is about one test: hemoglobin electrophoresis. The name comes from the old gel method, which is no longer in routine use. Today the test is done by HPLC or capillary electrophoresis.
By the end you should be able to pick up a report and read it in a fixed order. Who is the patient? Has anything changed the blood? What does the blood count say? Then the peaks, one by one.
We will keep coming back to one idea. The test tells you which hemoglobins are present and how much of each. It never makes a diagnosis on its own. The blood count, the film, the iron status and the history make the diagnosis with it.
The lecture builds on the hemoglobin electrophoresis slides in Anemia Part 3 and on Chapter 6 of the Hematology Handbook. The numbers are the same as in both.
Why we test
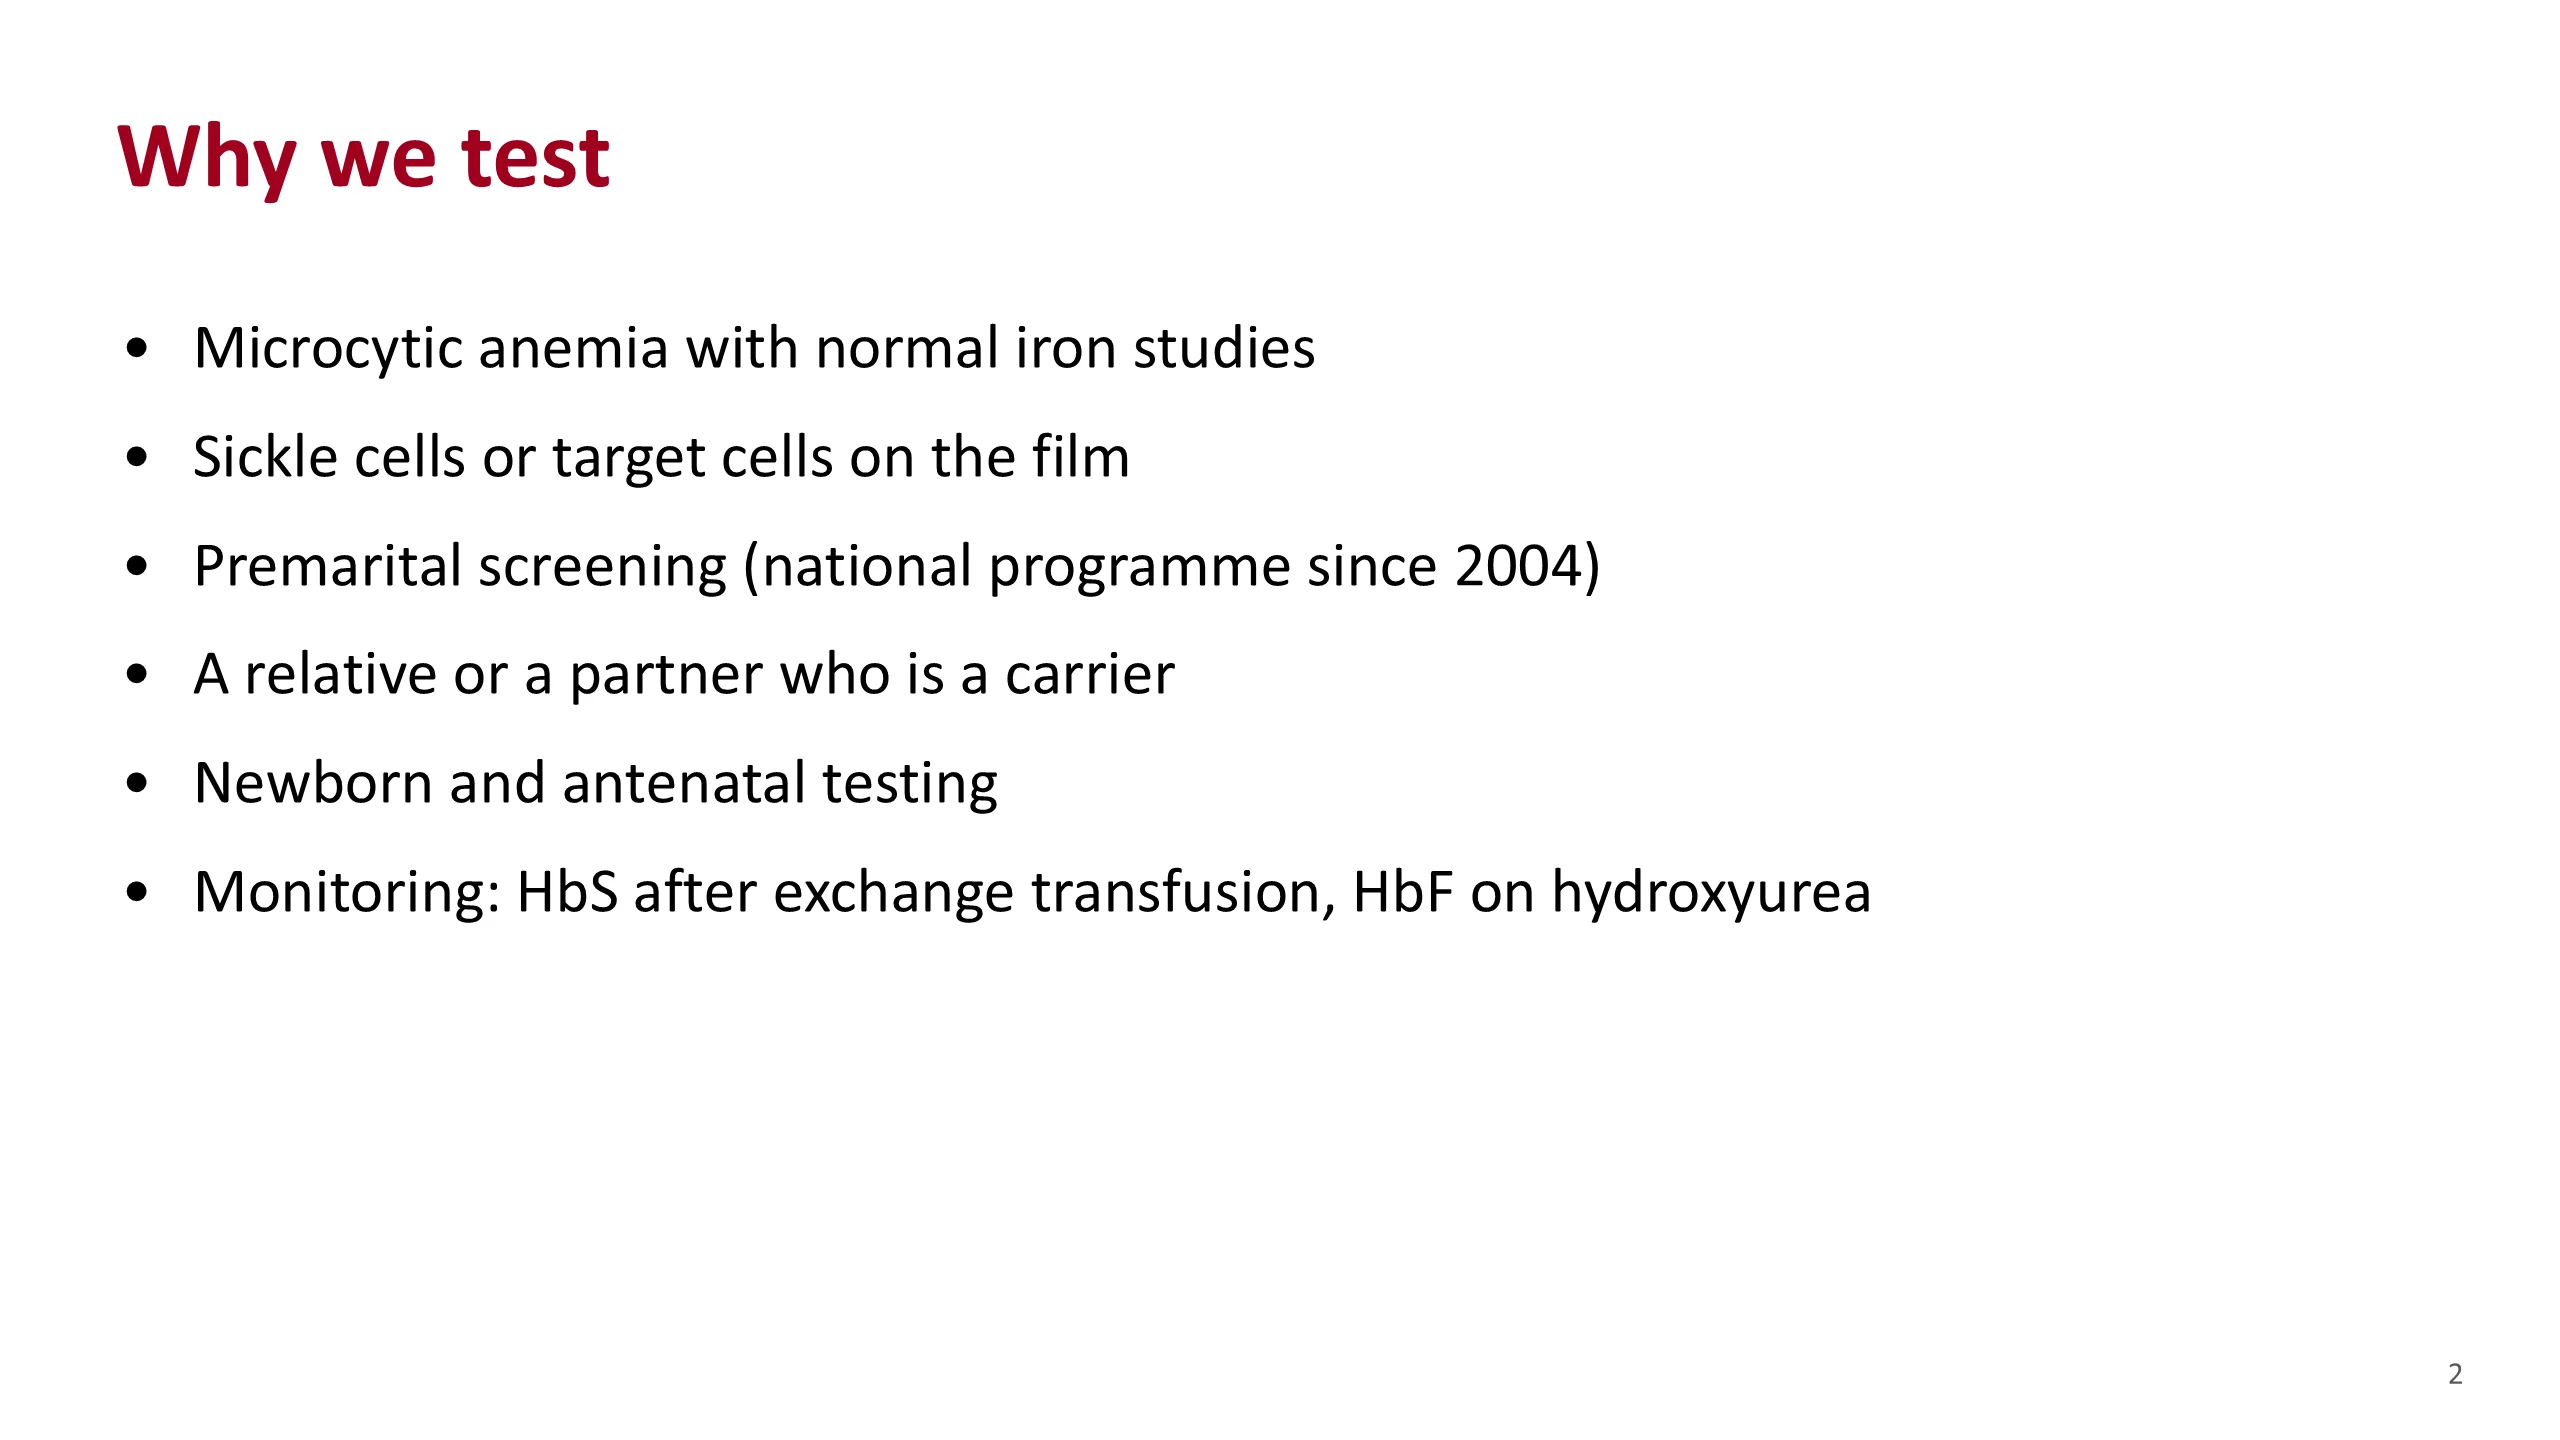
Start with the question the test answers. Which hemoglobins are present, and how much of each? Every use of the test comes back to that.
The commonest reason you will order it is a microcytic anemia where the iron studies are normal. Iron deficiency has been ruled out, so you are now looking for thalassemia.
The second is the film. Sickle cells point to hemoglobin S. Target cells with small red cells point to thalassemia. The film tells you what to expect before the result comes back.
The third is screening. In Saudi Arabia every couple planning to marry is tested. The national premarital programme began in 2004. You will see these reports often, in clinic and in your own families.
Then family testing, when a relative or a partner is a known carrier, and newborn testing.
Last, monitoring. In a patient with sickle cell disease who has an exchange transfusion, the lab measures how much hemoglobin S is left. In a patient on hydroxyurea, the lab follows the rise in hemoglobin F.
Sources. Hematology Handbook, chapter 6. Alhamdan et al., Genet Med 2007, for the start of the premarital programme. Bain, Haemoglobinopathy Diagnosis, 3rd edition, 2020, chapter 2, for HbS measurement after exchange transfusion.
Quantity and quality
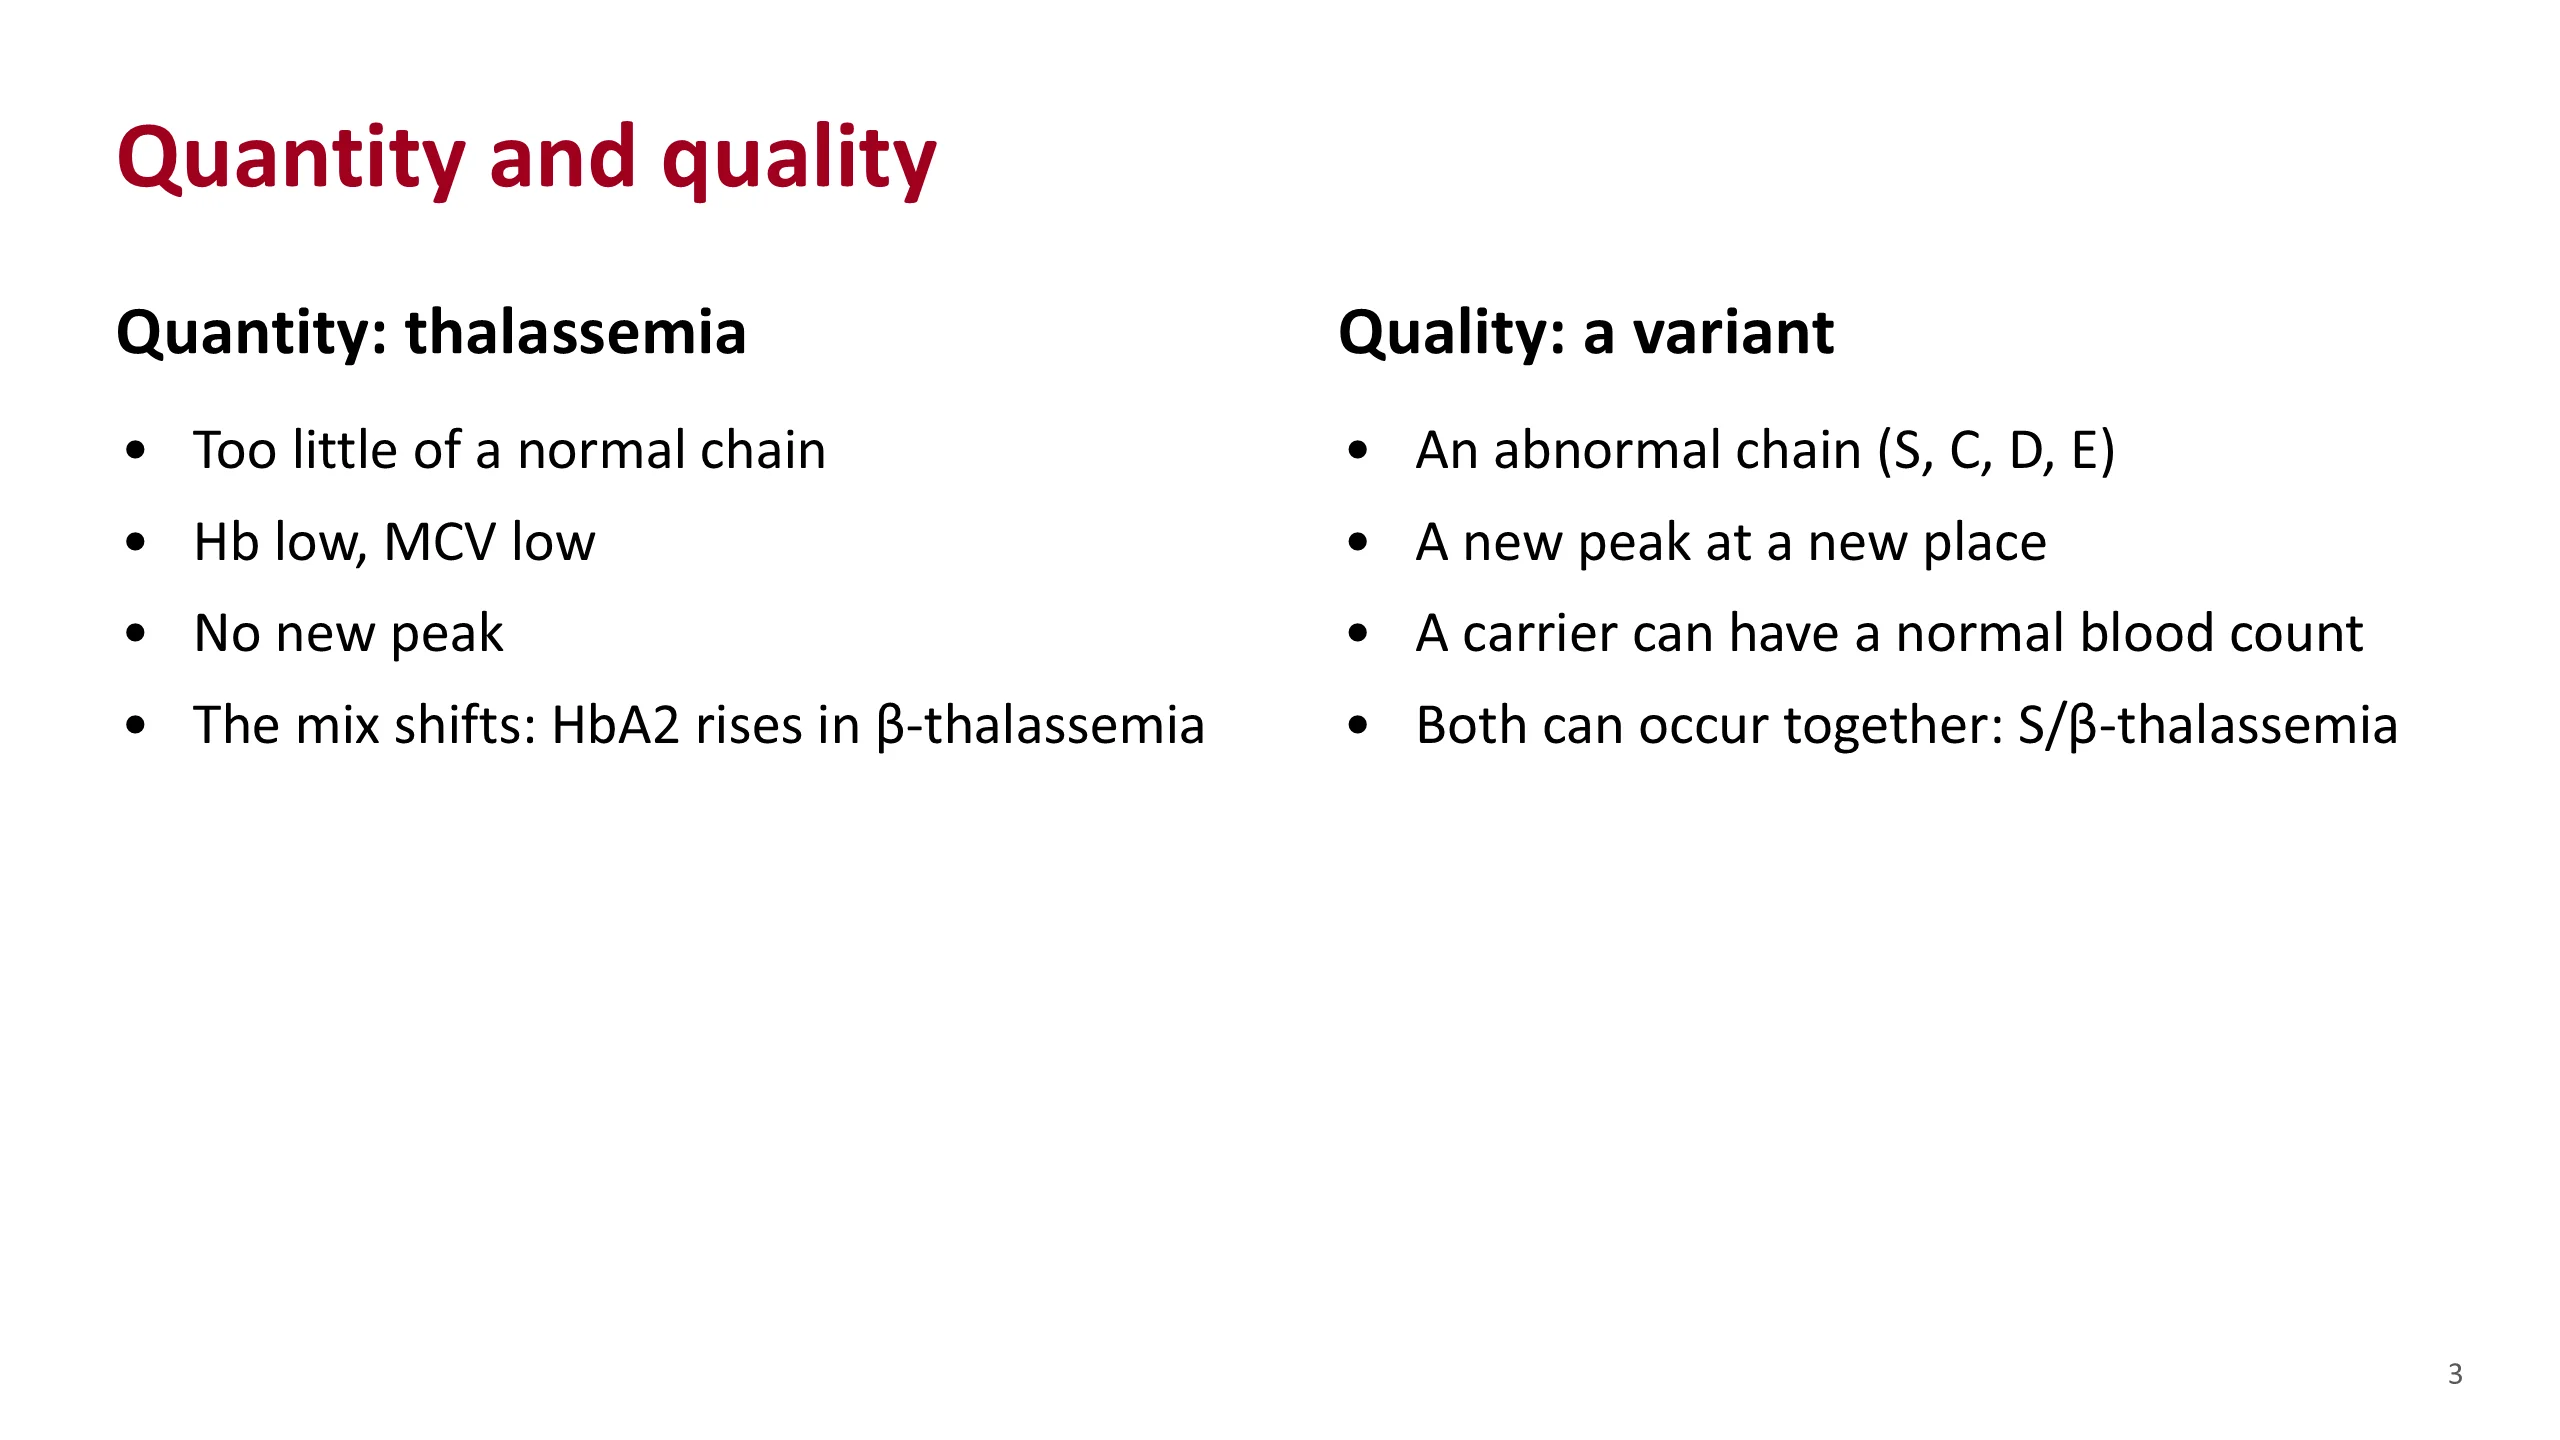
There are only two kinds of hemoglobin problem, and the whole test makes sense once you see them.
The first is quantity. In thalassemia, a normal globin chain is made, but too little of it. The hemoglobin concentration falls and the cells are small. No new hemoglobin appears. What changes is the mix. In beta-thalassemia, for example, the spare alpha chains pair with delta chains, so HbA2 rises.
The second is quality. In a variant such as sickle cell disease, an abnormal chain is made. Its charge is different, so it appears as a new peak at a new place on the trace. A carrier of a variant can have a completely normal blood count.
The old version of this lecture used milk to make the point, and it still works. The blood count tells you how much milk is in the carton. Electrophoresis tells you what kind of milk it is. Thalassemia is too little milk of the normal kind. A variant is a different kind of milk.
The two can come together in one person. Sickle-beta-thalassemia is a quality gene on one chromosome and a quantity gene on the other. We will meet it later.
Source. Hematology Handbook, chapter 6.
Normal hemoglobins
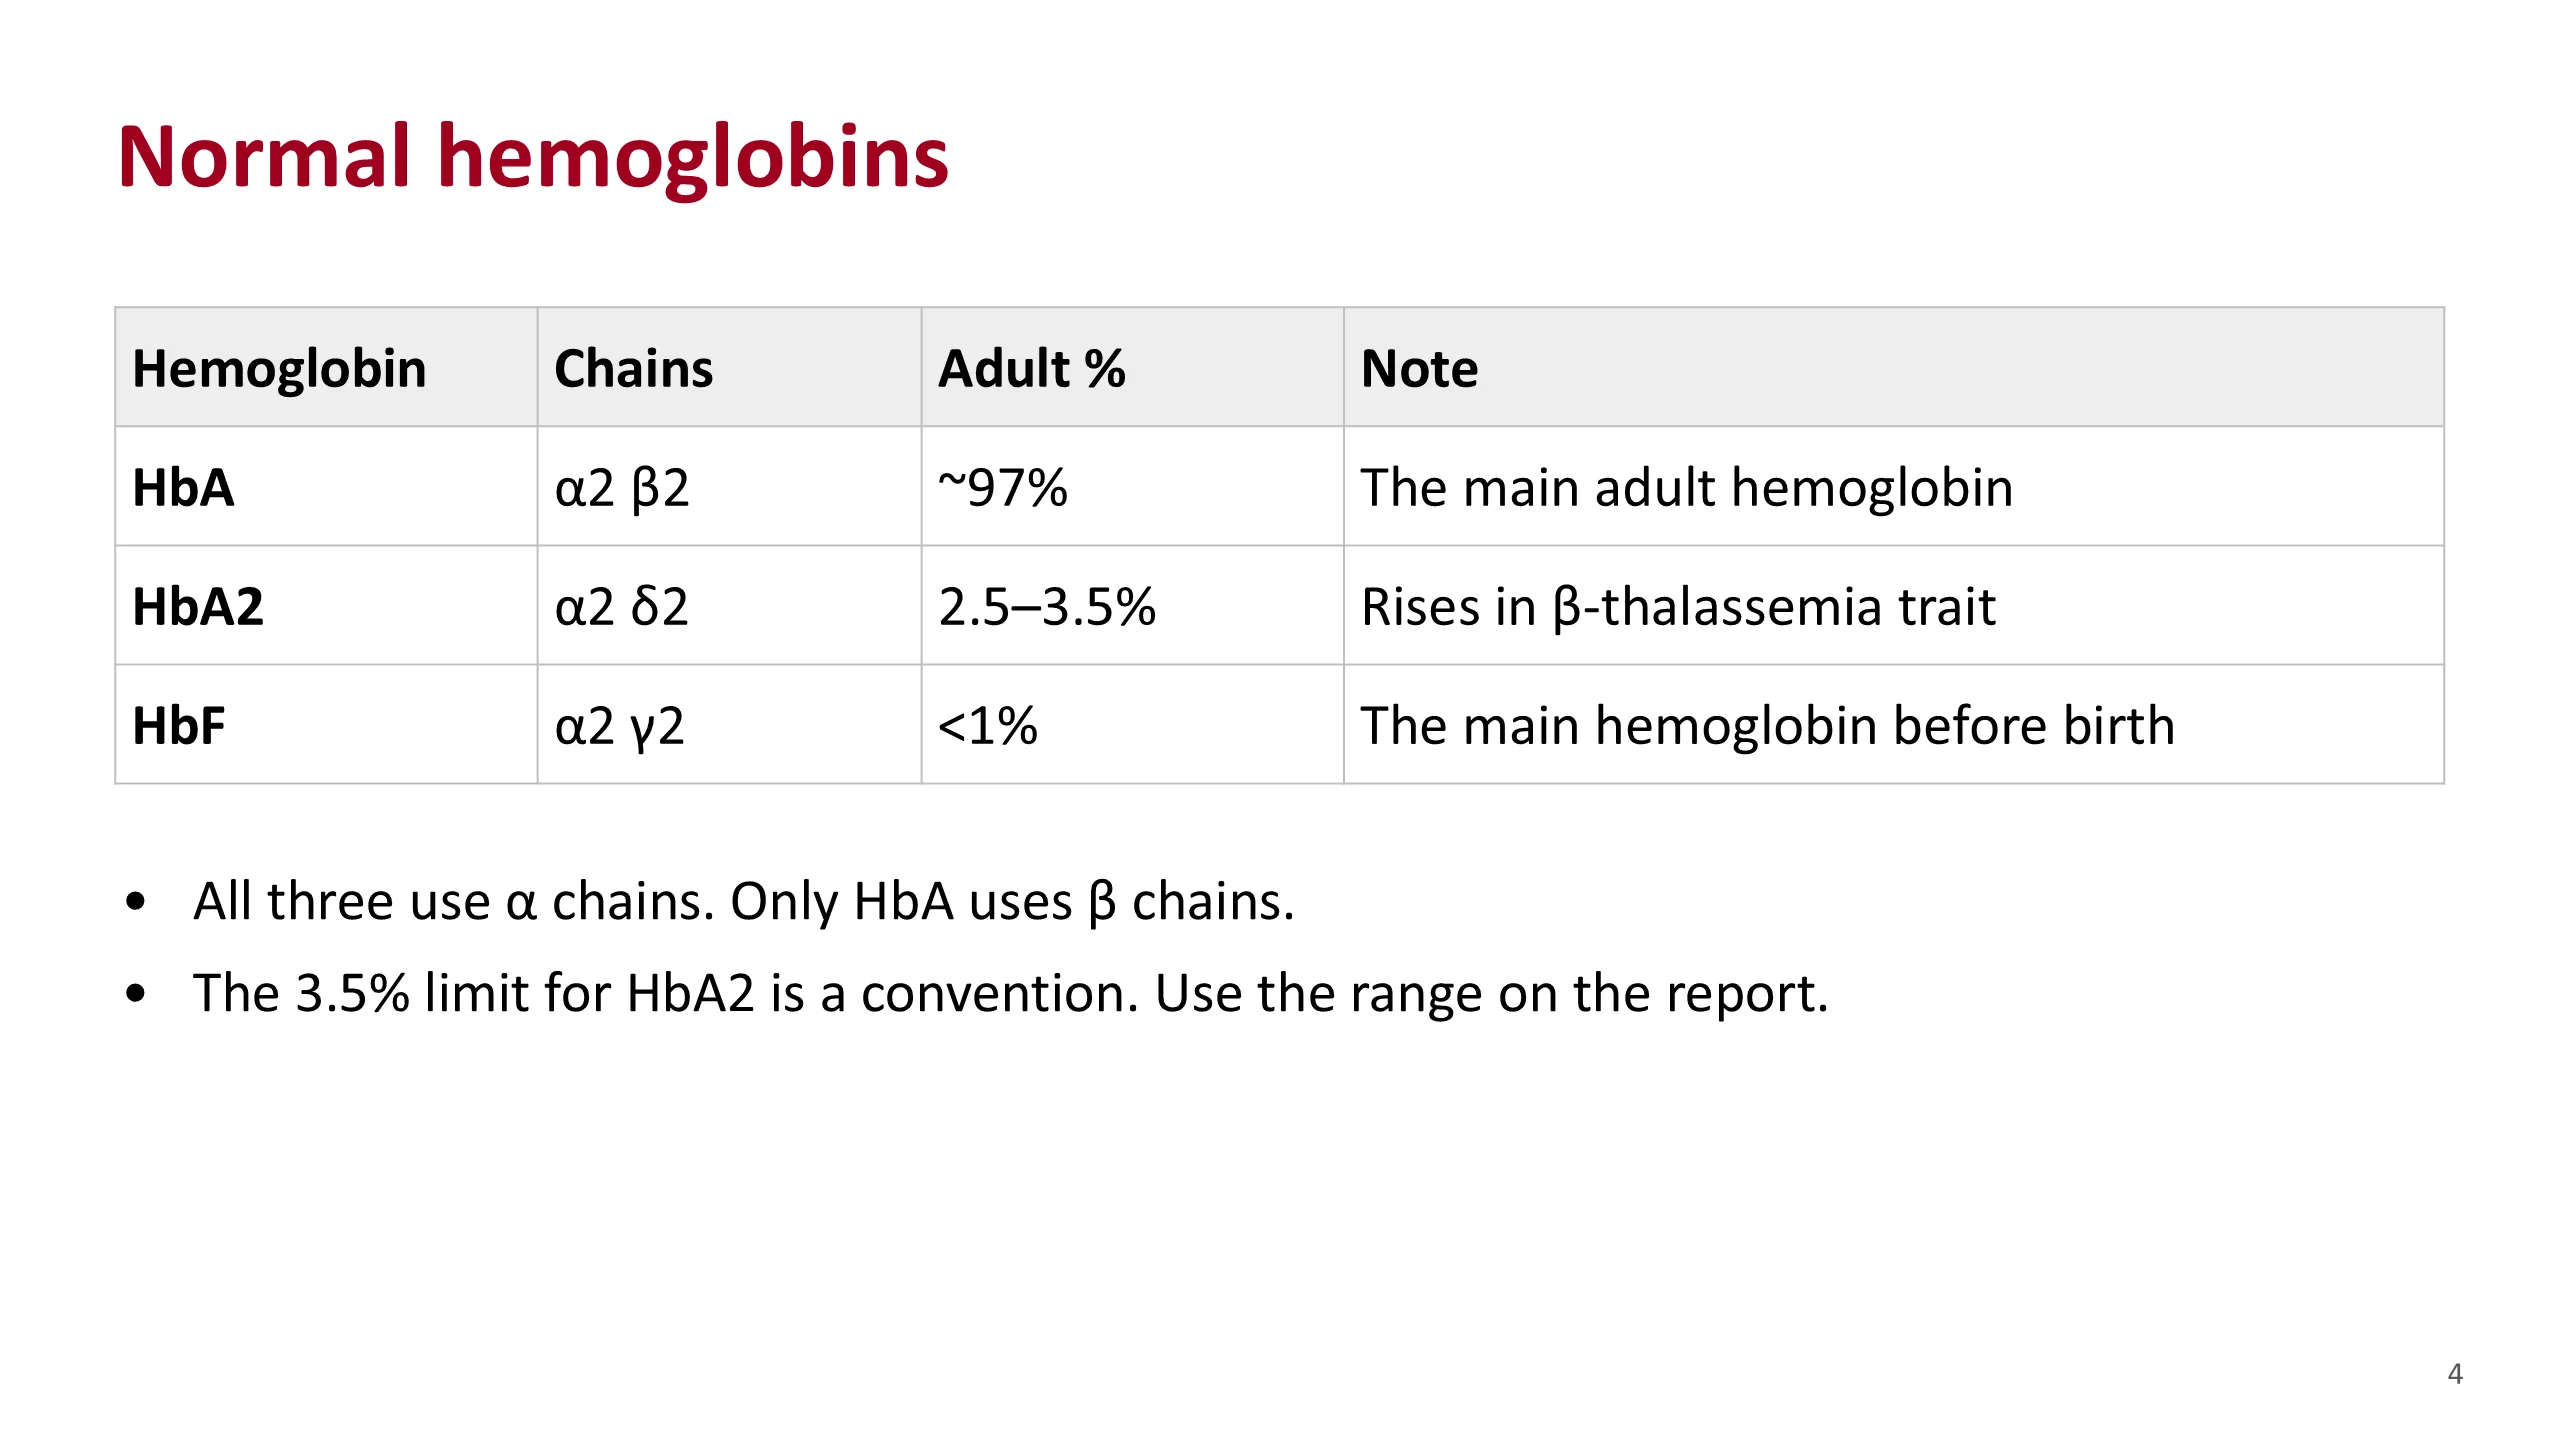
Each hemoglobin molecule has four globin chains: two alpha chains and two partner chains. The partner decides the name.
HbA has two beta chains. It is the main adult hemoglobin, about 97% of the total.
HbA2 has two delta chains. It is a small fraction, 2.5 to 3.5%. Its rise is the marker of beta-thalassemia trait.
HbF has two gamma chains. It is the main hemoglobin before birth. In adults it is below 1%.
Notice the line under the table. All three use alpha chains. Only HbA uses beta chains. Keep that in mind, because it explains two things we will see later. A shortage of alpha chain lowers all three together, so the pattern looks normal. A shortage of beta chain lowers only HbA, so A2 and F rise in proportion.
Be honest with students about the cut-offs. The upper limit of 3.5% for HbA2 is a convention. Instruments do not agree exactly. In one study of the same 40 samples, the mean HbA2 ranged from 2.7 to 3.1% across five HPLC instruments, and from 2.4 to 3.0% across three capillary instruments. Each laboratory sets its own range, so read the range printed on the report.
Sources. Hematology Handbook, chapter 6, for the three percentages. Bain, Haemoglobinopathy Diagnosis, 3rd edition, 2020, chapter 2, for the variation between instruments.
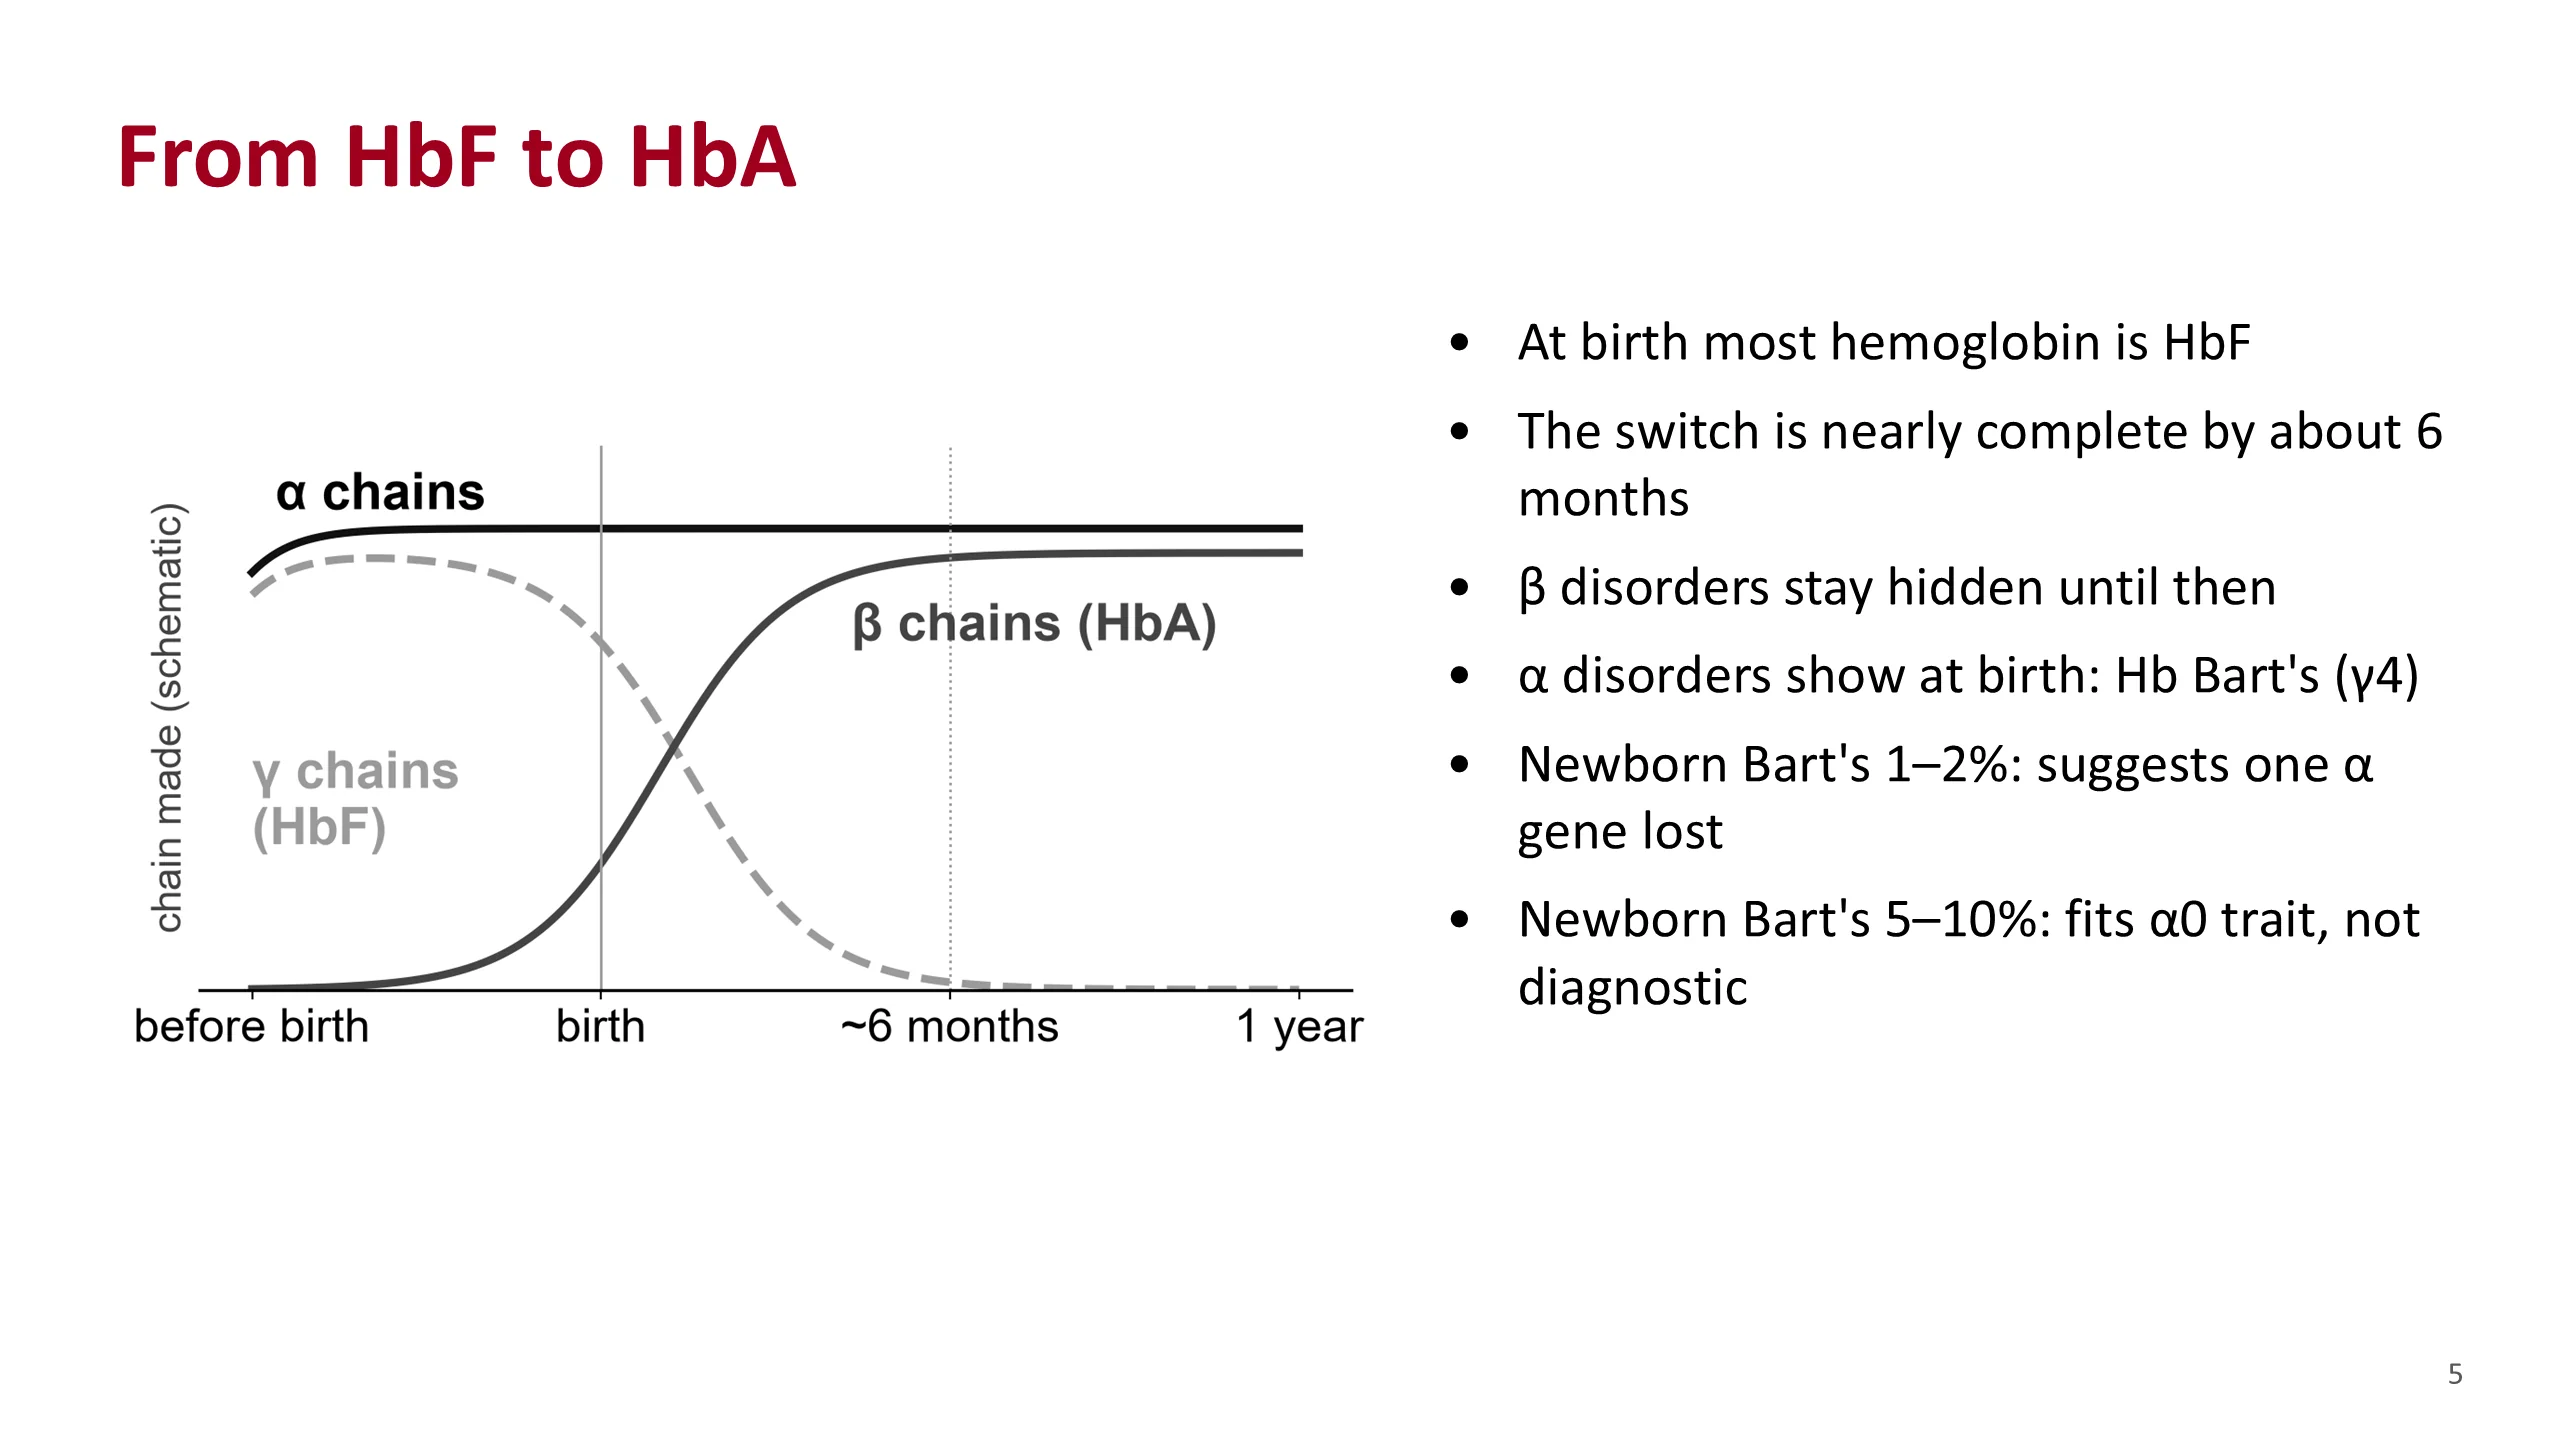
From HbF to HbA
Before birth, the partner chain is mostly gamma, so most hemoglobin is HbF. Around birth the gamma chain falls and the beta chain rises. The handbook puts the switch as nearly complete by about six months. The figure is a drawing, not data.
This has a practical result. A beta-chain disorder cannot show itself until the beta chain matters. A baby with beta-thalassemia major, or with sickle cell disease, can look well at birth. The disease appears as HbF falls in the first months of life. So a normal-looking result in a young baby does not exclude a beta disorder.
Alpha chains are different. They are needed for HbF too, so an alpha disorder shows at birth. In the newborn, spare gamma chains join together in fours. That is Hb Bart's.
Bain gives two useful figures for the newborn. A Bart's level of 1 to 2% suggests one alpha gene is missing. A level of 5 to 10% fits alpha-zero trait, two genes missing on one chromosome, but is not diagnostic on its own. Not every baby with one gene missing has a raised Bart's.
So when you read a newborn's result, the questions change. Expect lots of HbF. Look for Bart's. Do not expect a beta disorder to be obvious.
Sources. Hematology Handbook, chapter 6, for the switch. Bain, Haemoglobinopathy Diagnosis, 3rd edition, 2020, chapter 3, for the newborn Hb Bart's levels.
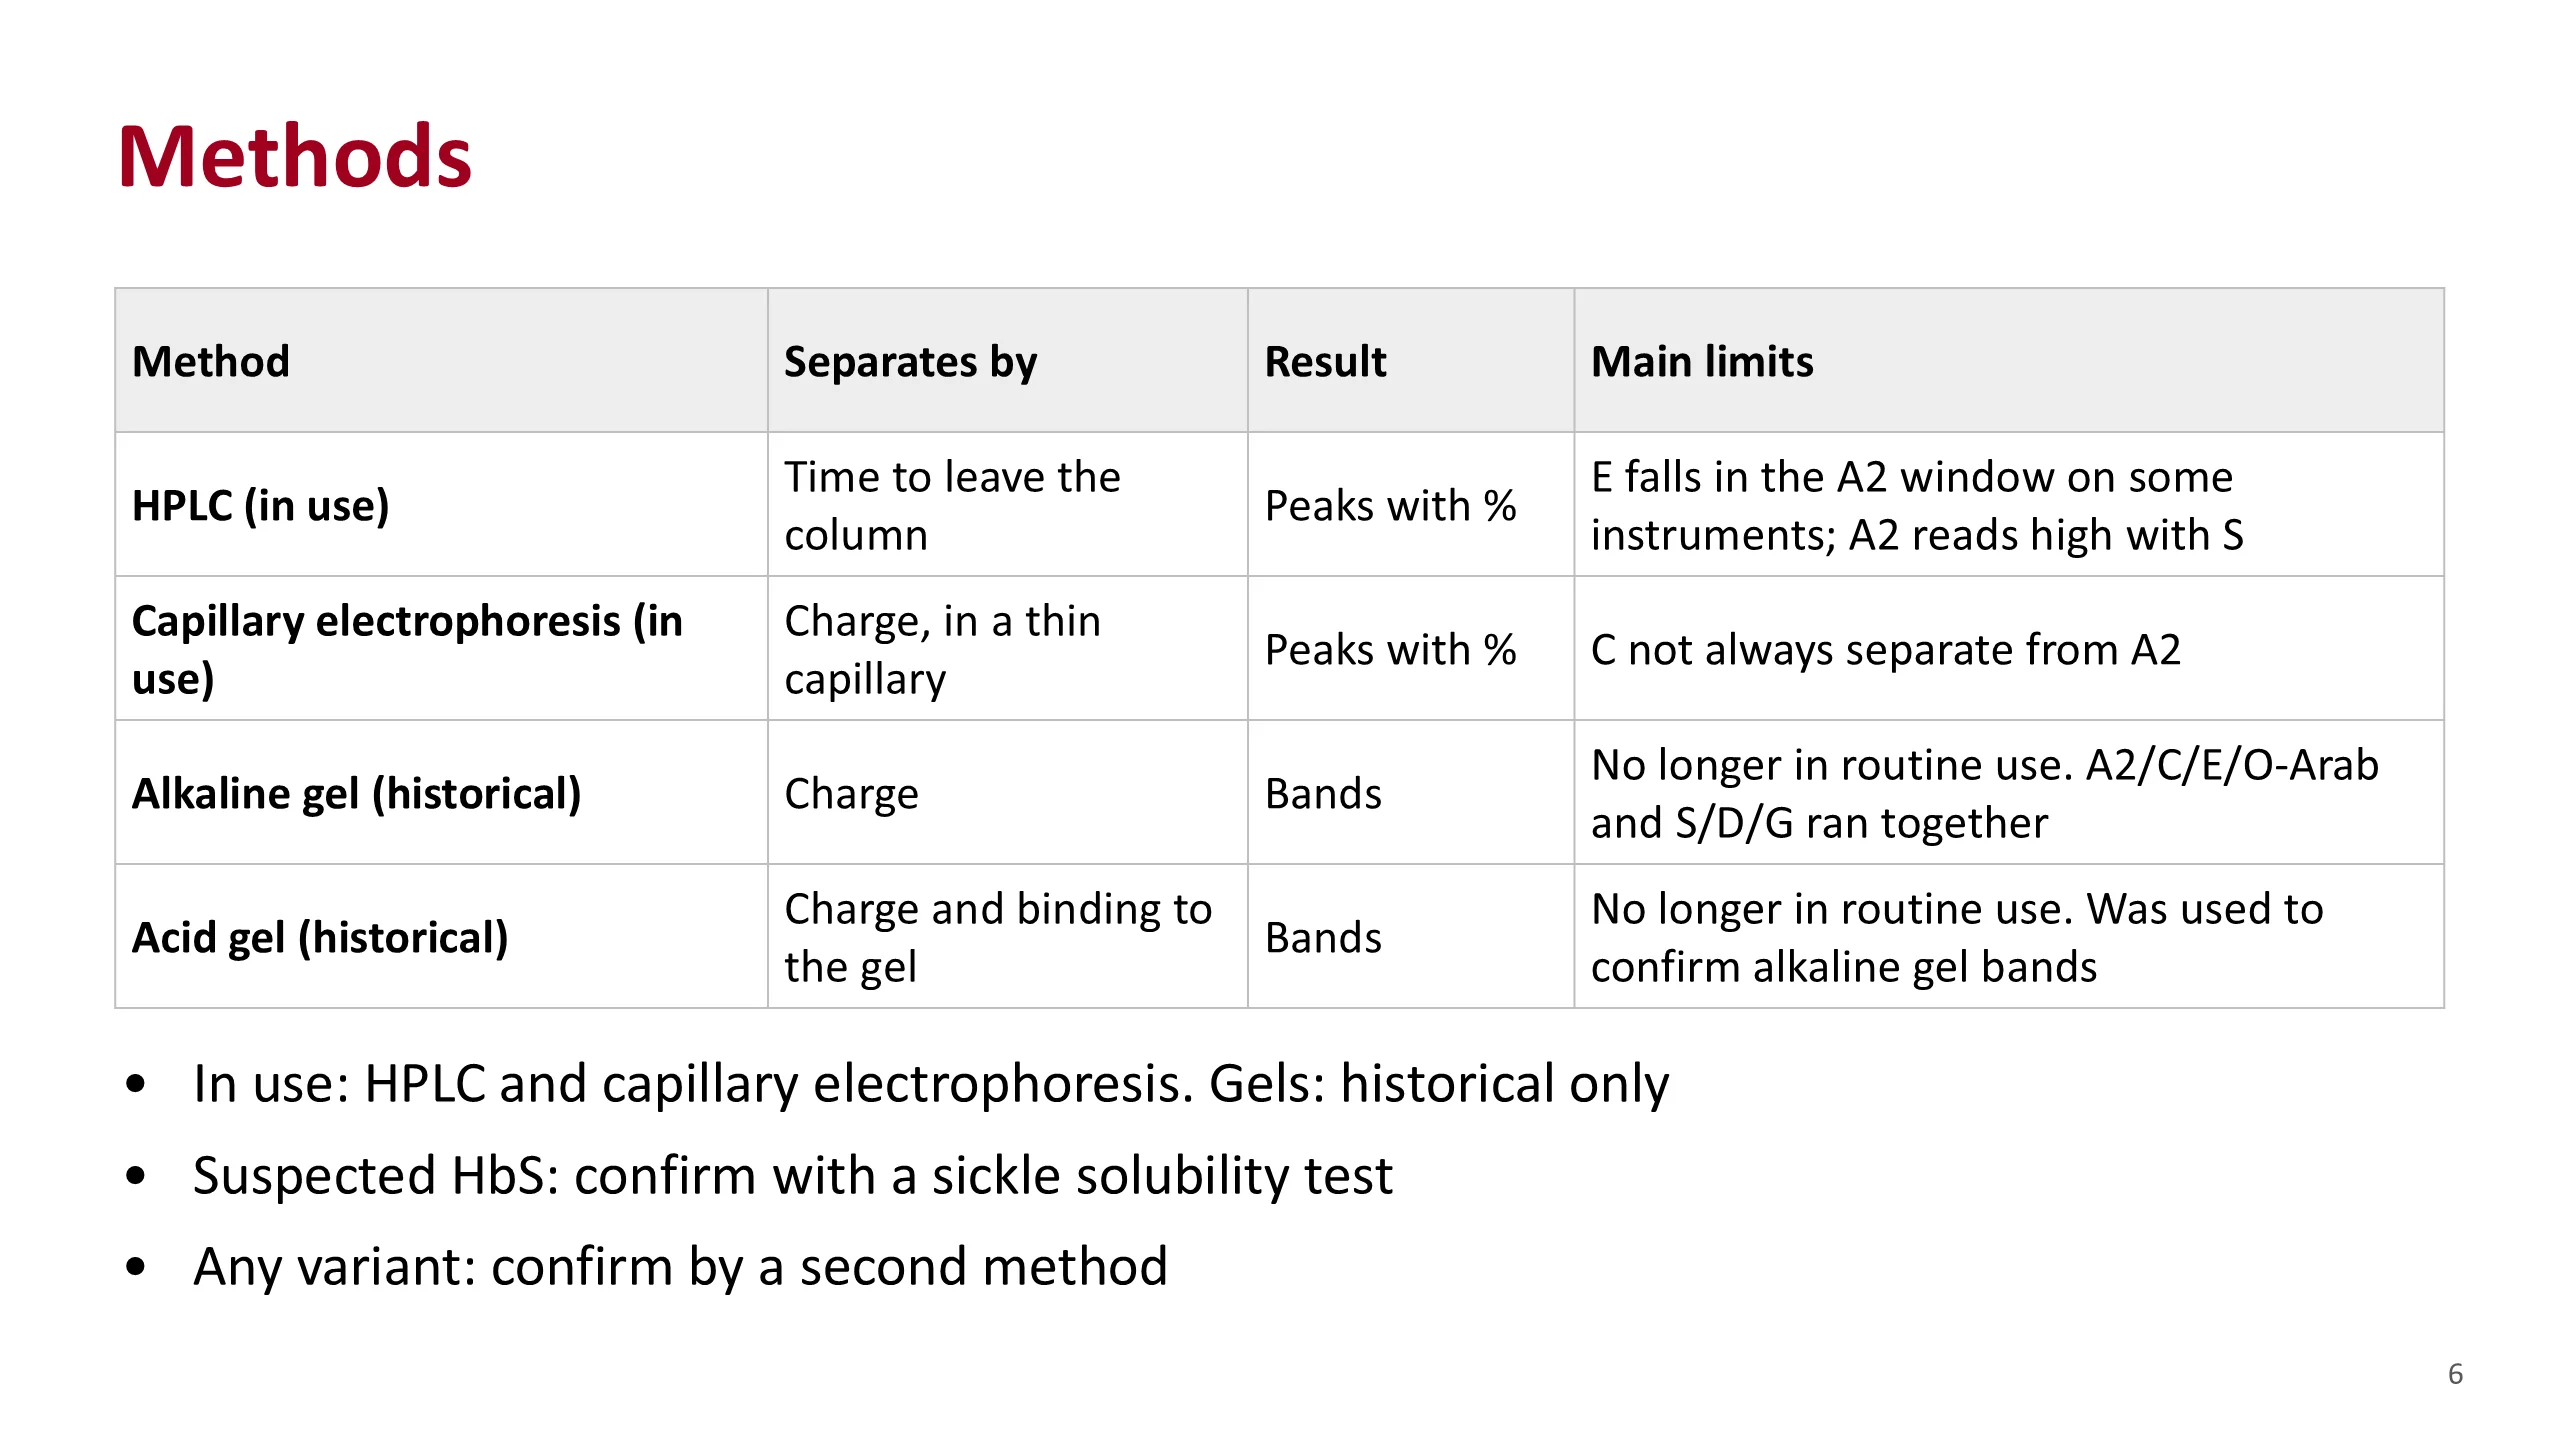
Methods
Two methods are in use today: HPLC and capillary electrophoresis. Both separate the hemoglobins and measure each one as a percentage. Every report you read in practice comes from one of them.
HPLC, high performance liquid chromatography, is the standard method for measuring A2 and F. It gives peaks with percentages.
Capillary electrophoresis also gives peaks with percentages. It is charge based, like the old gel, but runs in a thin tube.
The gels in the bottom two rows are historical. They are no longer in routine use, and you will not be asked to read one in practice. They are on the slide for one reason: the test is still called electrophoresis because of them, and some of the teaching you will meet in older books, such as "A2, C, E and O-Arab run together", comes from the alkaline gel.
Two rules sit under the table. A suspected HbS is checked with a sickle solubility test. And any variant found by one method is confirmed by a second, for example the other of the two methods, or DNA testing.
Sources. Bain, Haemoglobinopathy Diagnosis, 3rd edition, 2020, chapter 2, for every entry in the table. Hematology Handbook, chapter 6, for the rule on a second method.
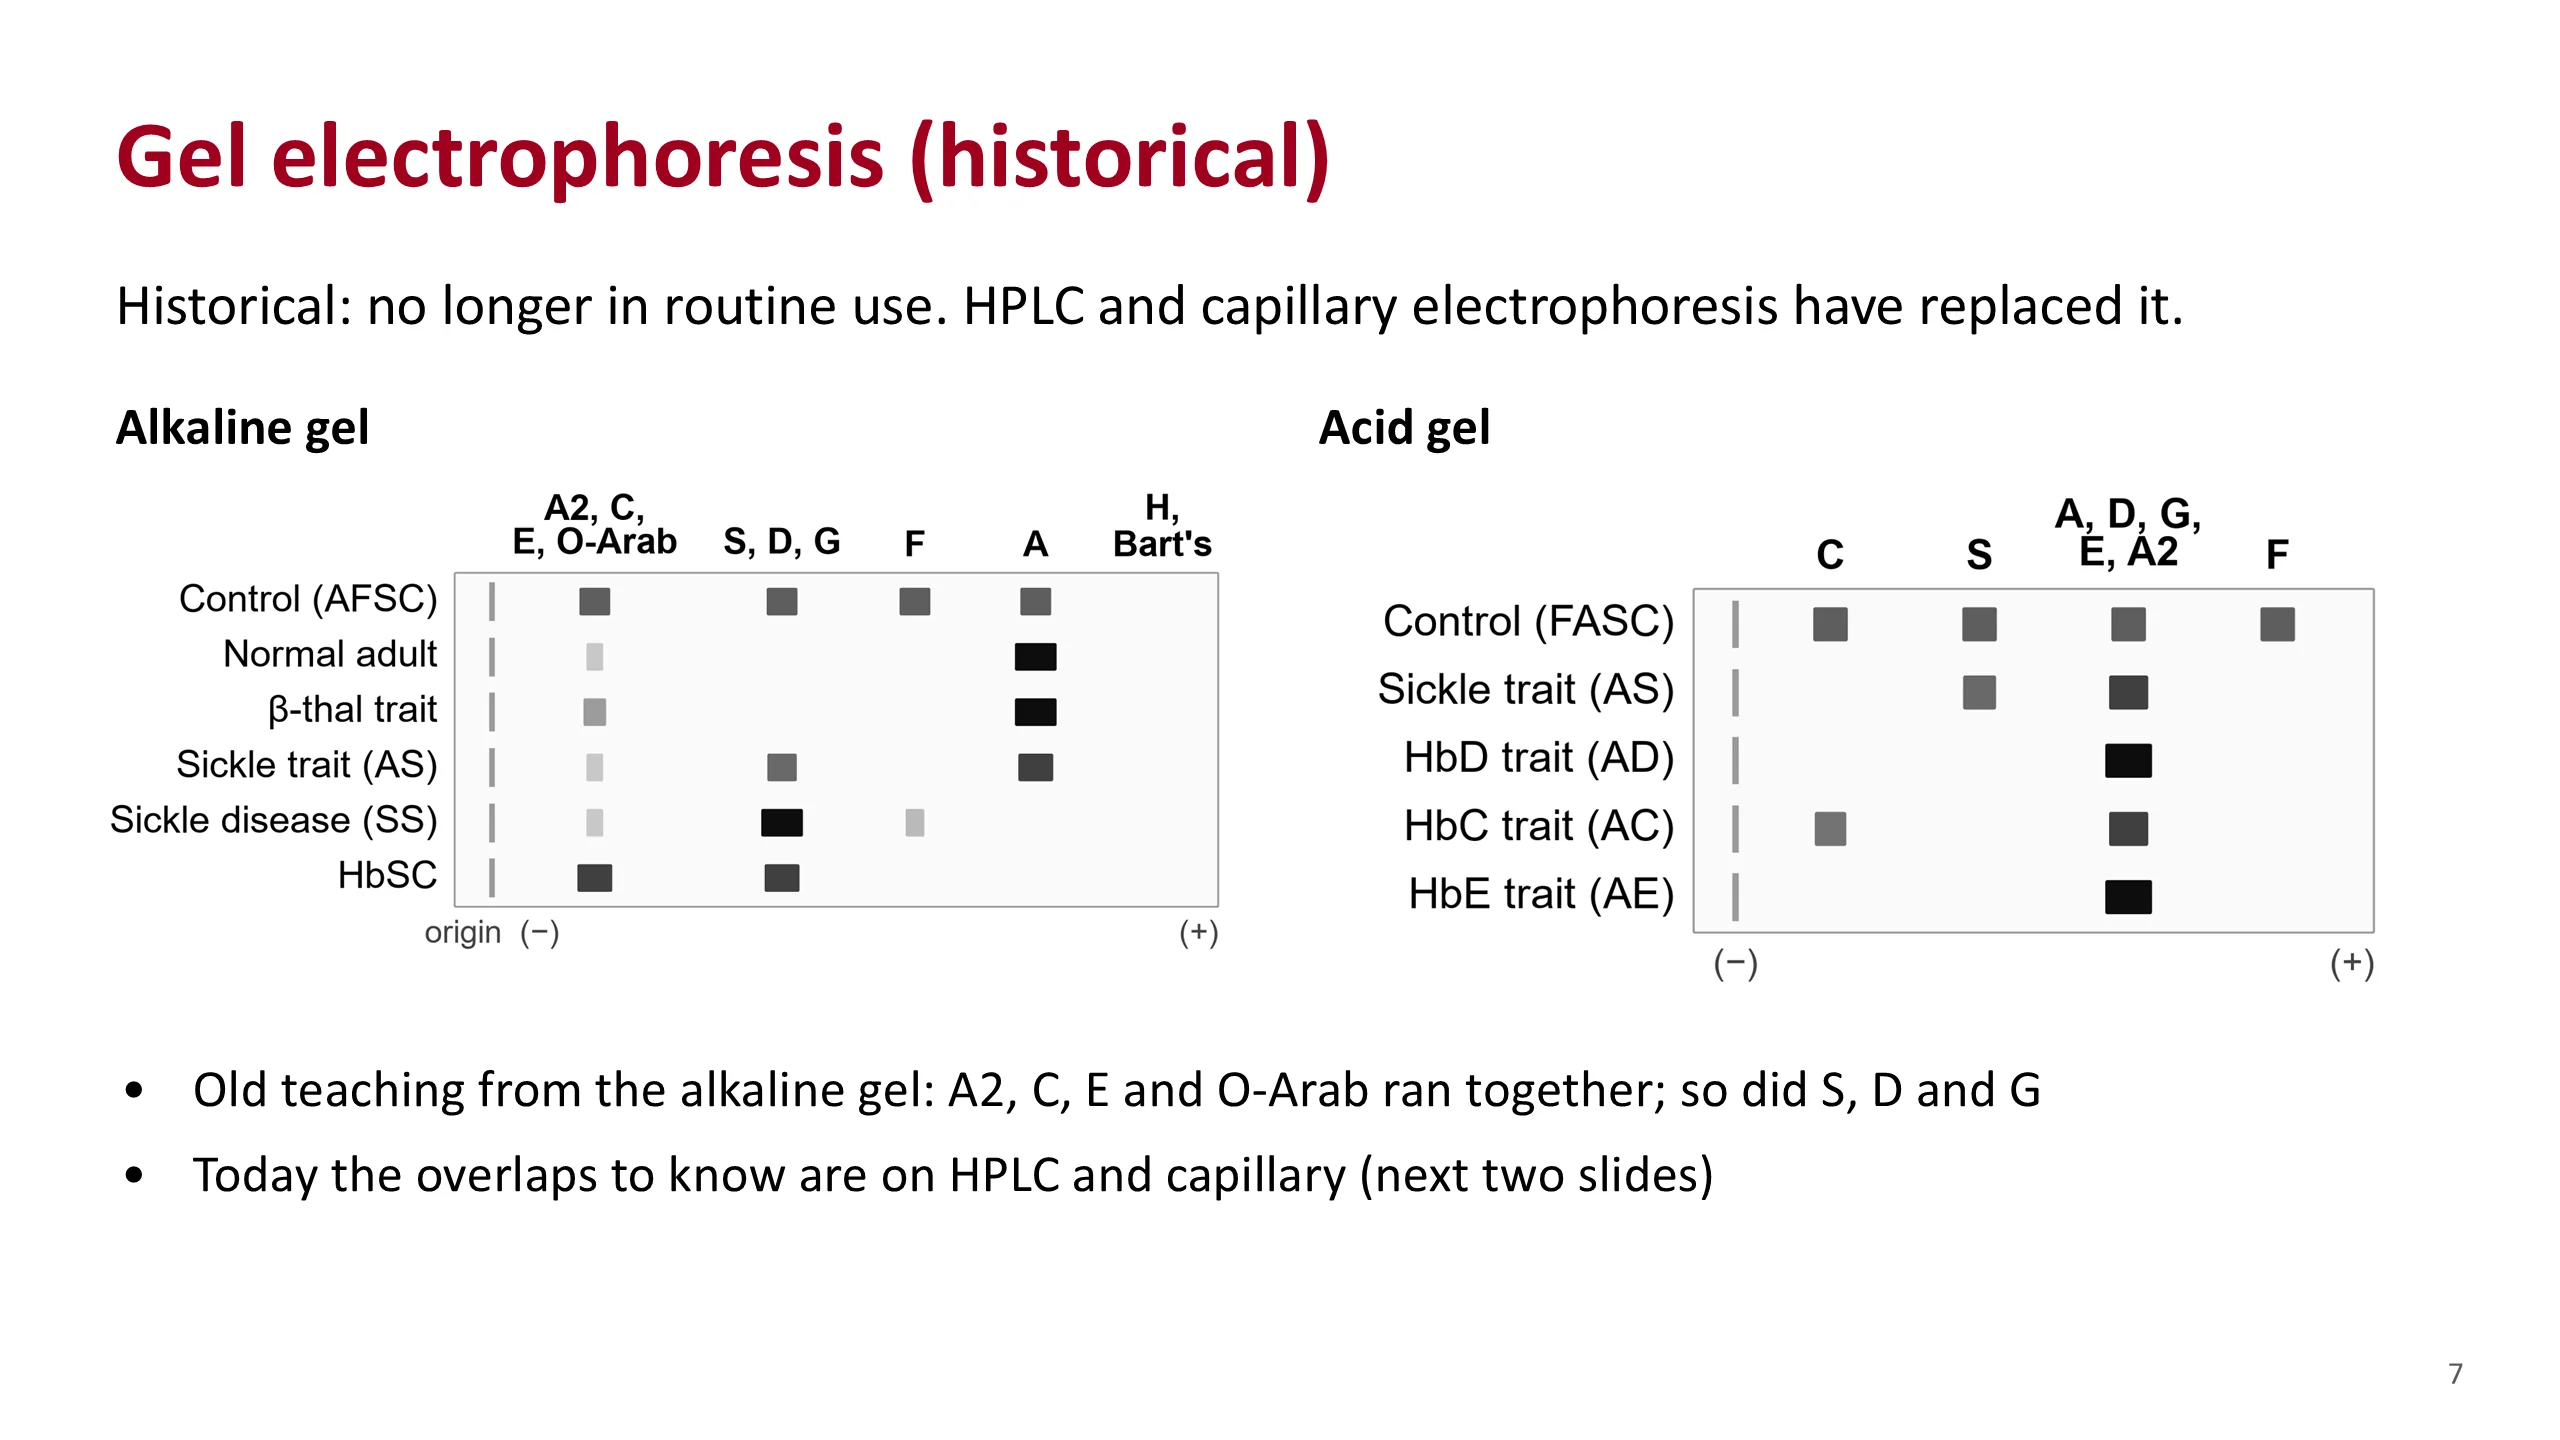
Gel electrophoresis (historical)
Gel electrophoresis is historical. It is no longer in routine use. HPLC and capillary electrophoresis have replaced it. This slide is here so that you know where the name of the test and some old teaching come from.
The drawings are not real runs. On the alkaline gel, at a pH of about 8.2 to 8.6, hemoglobin is negatively charged and moves toward the positive pole. HbA moved furthest. HbF was a little slower, then S, D and G together, and A2, C, E and O-Arab together closest to the start. Hb H and Bart's ran beyond A. Because several hemoglobins shared one place, a band at the S position was not proof of HbS, and A2 could not be measured precisely enough to diagnose beta-thalassemia trait.
The acid gel, at a pH of about 6.0 to 6.2, was the second look. It separated S from D and G, which run with A at that pH, and C from E and O-Arab. It did not separate A2 from A.
What carries over to today. HPLC and capillary electrophoresis still have overlaps of their own, and they are taught on the next two slides: HbE falls in the A2 window on some HPLC instruments, and HbC does not always separate from A2 on capillary electrophoresis. A peak in the S window is still confirmed with a solubility test.
Source. Bain, Haemoglobinopathy Diagnosis, 3rd edition, 2020, chapter 2, figure 2.6 and text, and figure 4.32 for the acid gel order F, A, S, C.
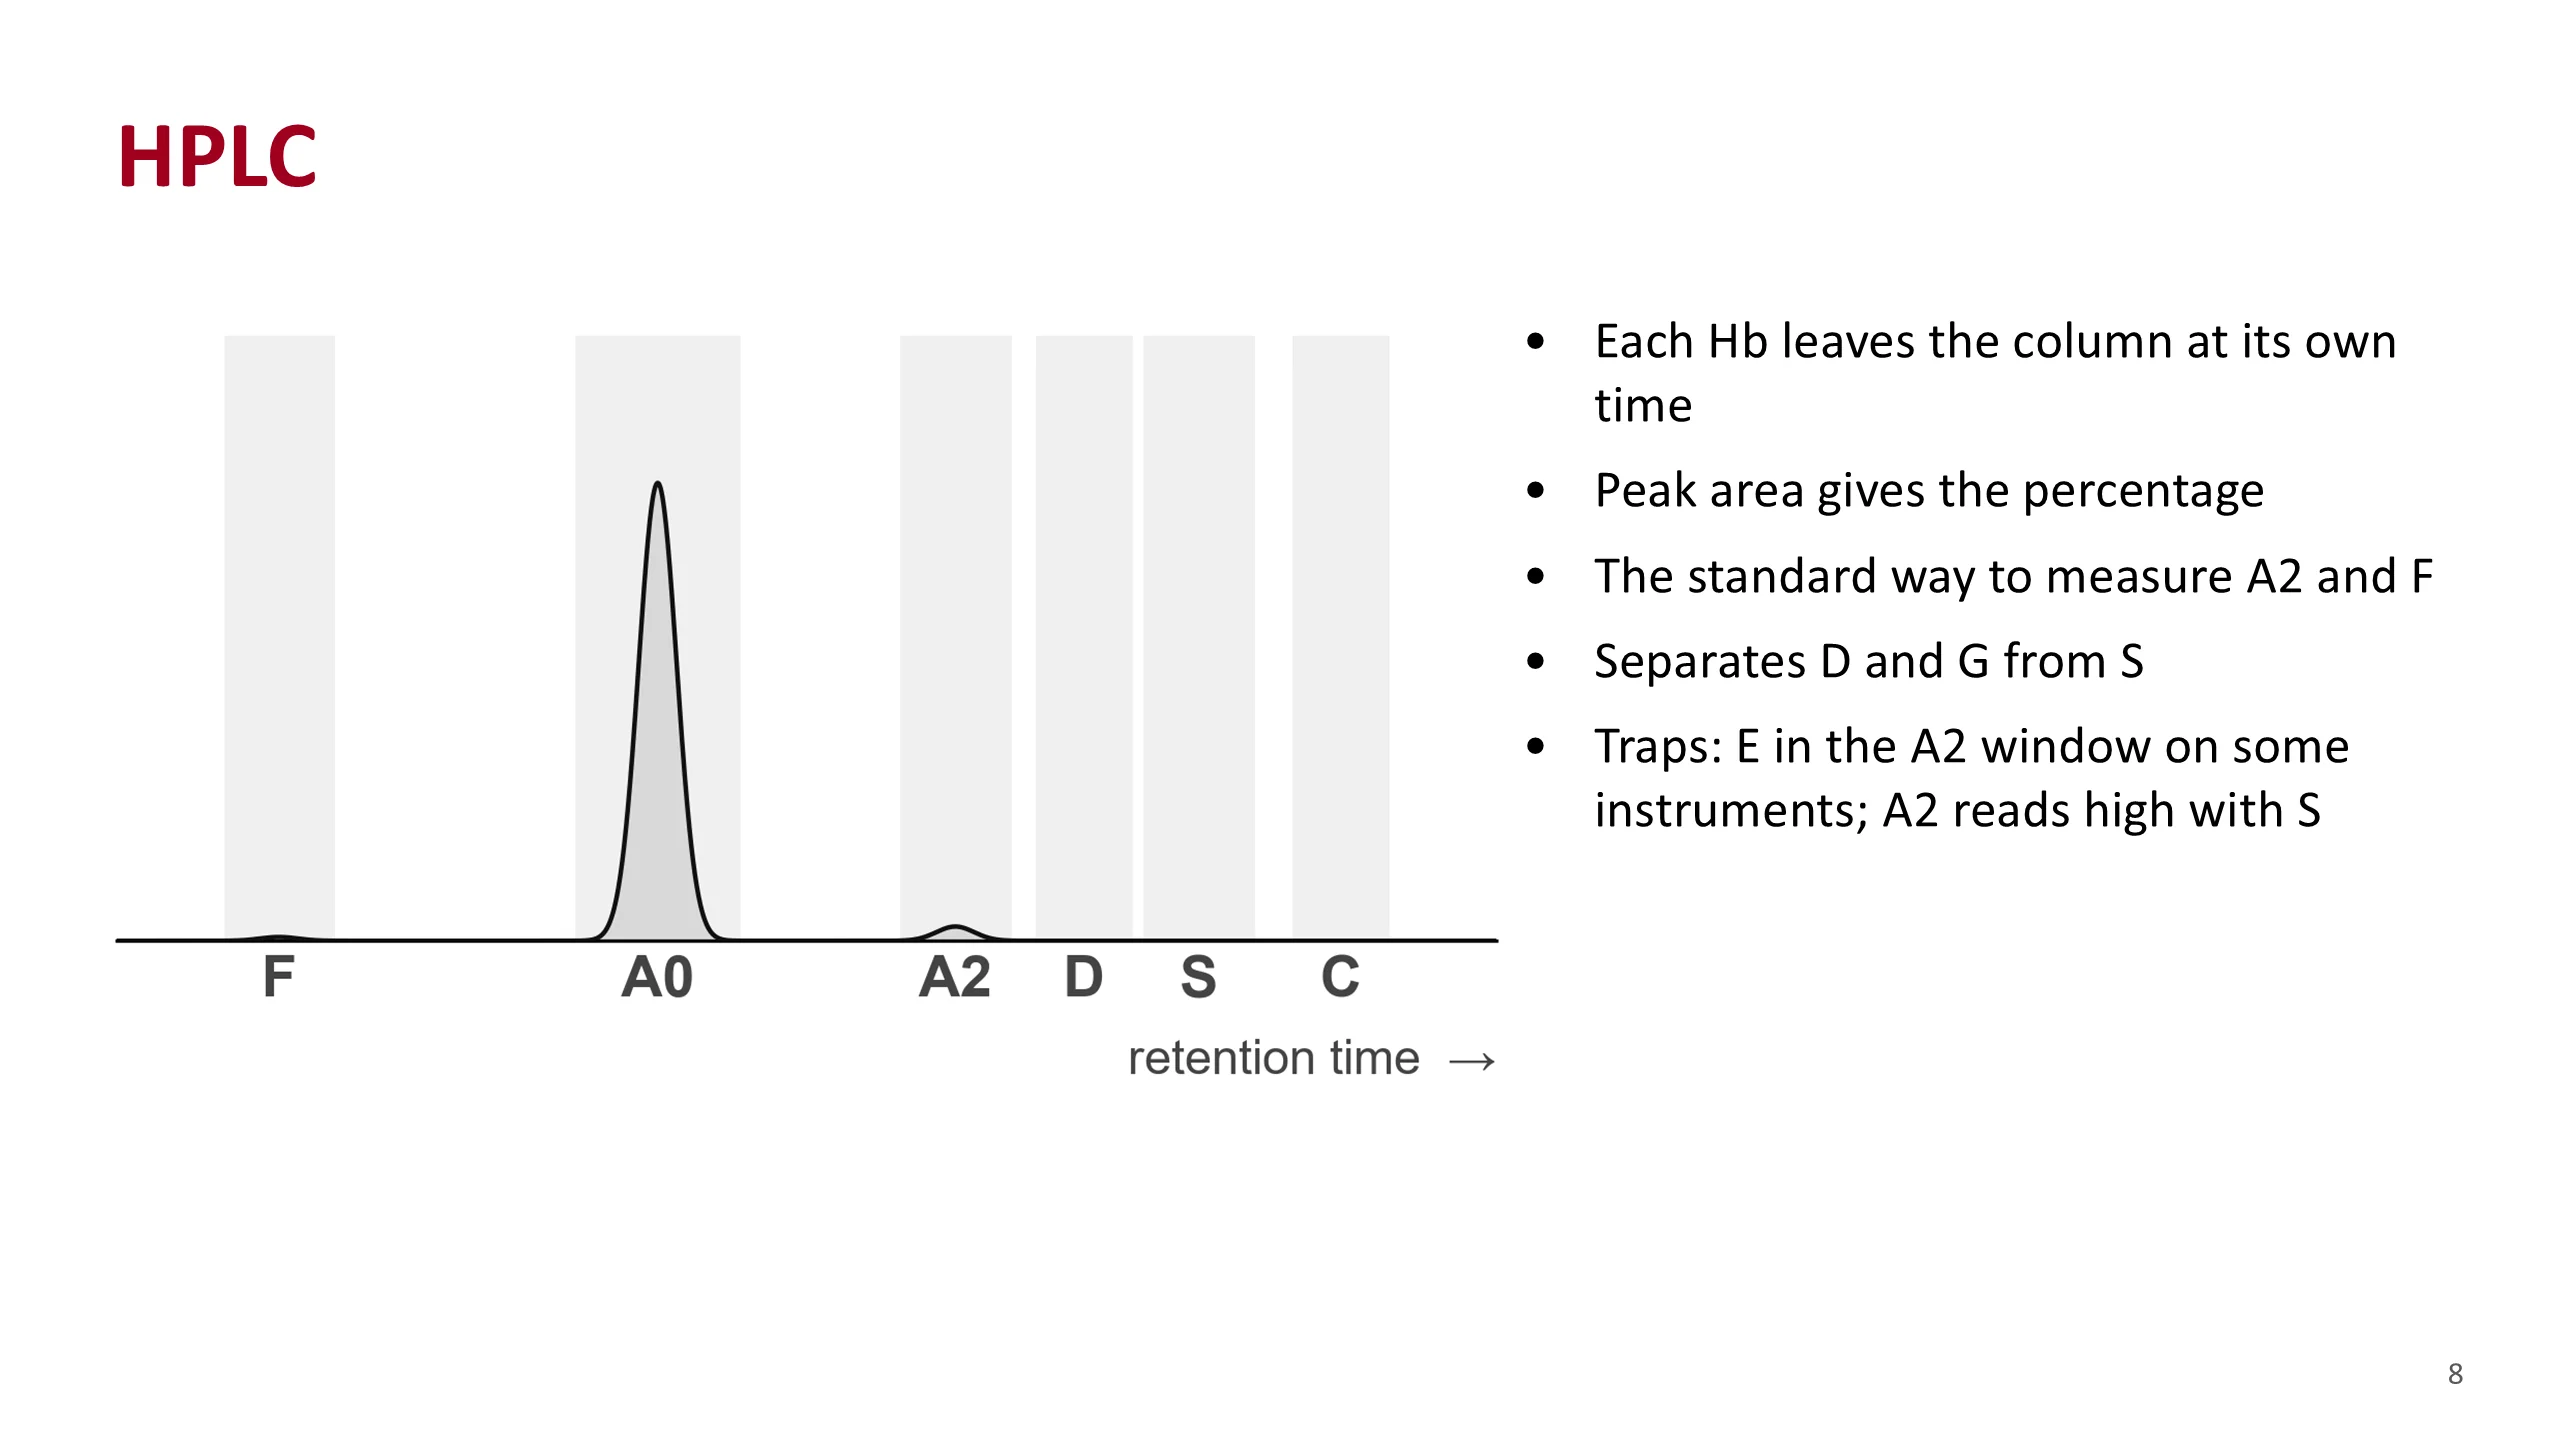
HPLC
HPLC is the method most laboratories use now, and the one behind most reports you will read.
The blood is passed through a column that holds on to hemoglobin. A liquid with a rising salt concentration then washes each hemoglobin off at its own time. That time is the retention time. A detector draws a peak as each one comes off. The area under the peak gives its percentage.
Each hemoglobin is expected in a window. The figure shows the usual order: F first, then A, then A2, then the D, S and C windows. A peak in a window is a provisional identity, not a final one.
HPLC separates D-Punjab and G from S, which the old alkaline gel could not.
Know its traps. On some instruments HbE comes off in the A2 window, so a patient with HbE trait seems to have a very high A2. In a patient with HbS, a modified form of HbS falls in the A2 window, so the A2 reads a little high. And because the glycated fraction is also measured, HPLC sometimes shows an unexpected diabetes.
The figure is a drawing of a normal pattern. Window positions are relative, not times.
Source. Bain, Haemoglobinopathy Diagnosis, 3rd edition, 2020, chapter 2, for the principle, the order of the windows and each limitation.
Capillary electrophoresis
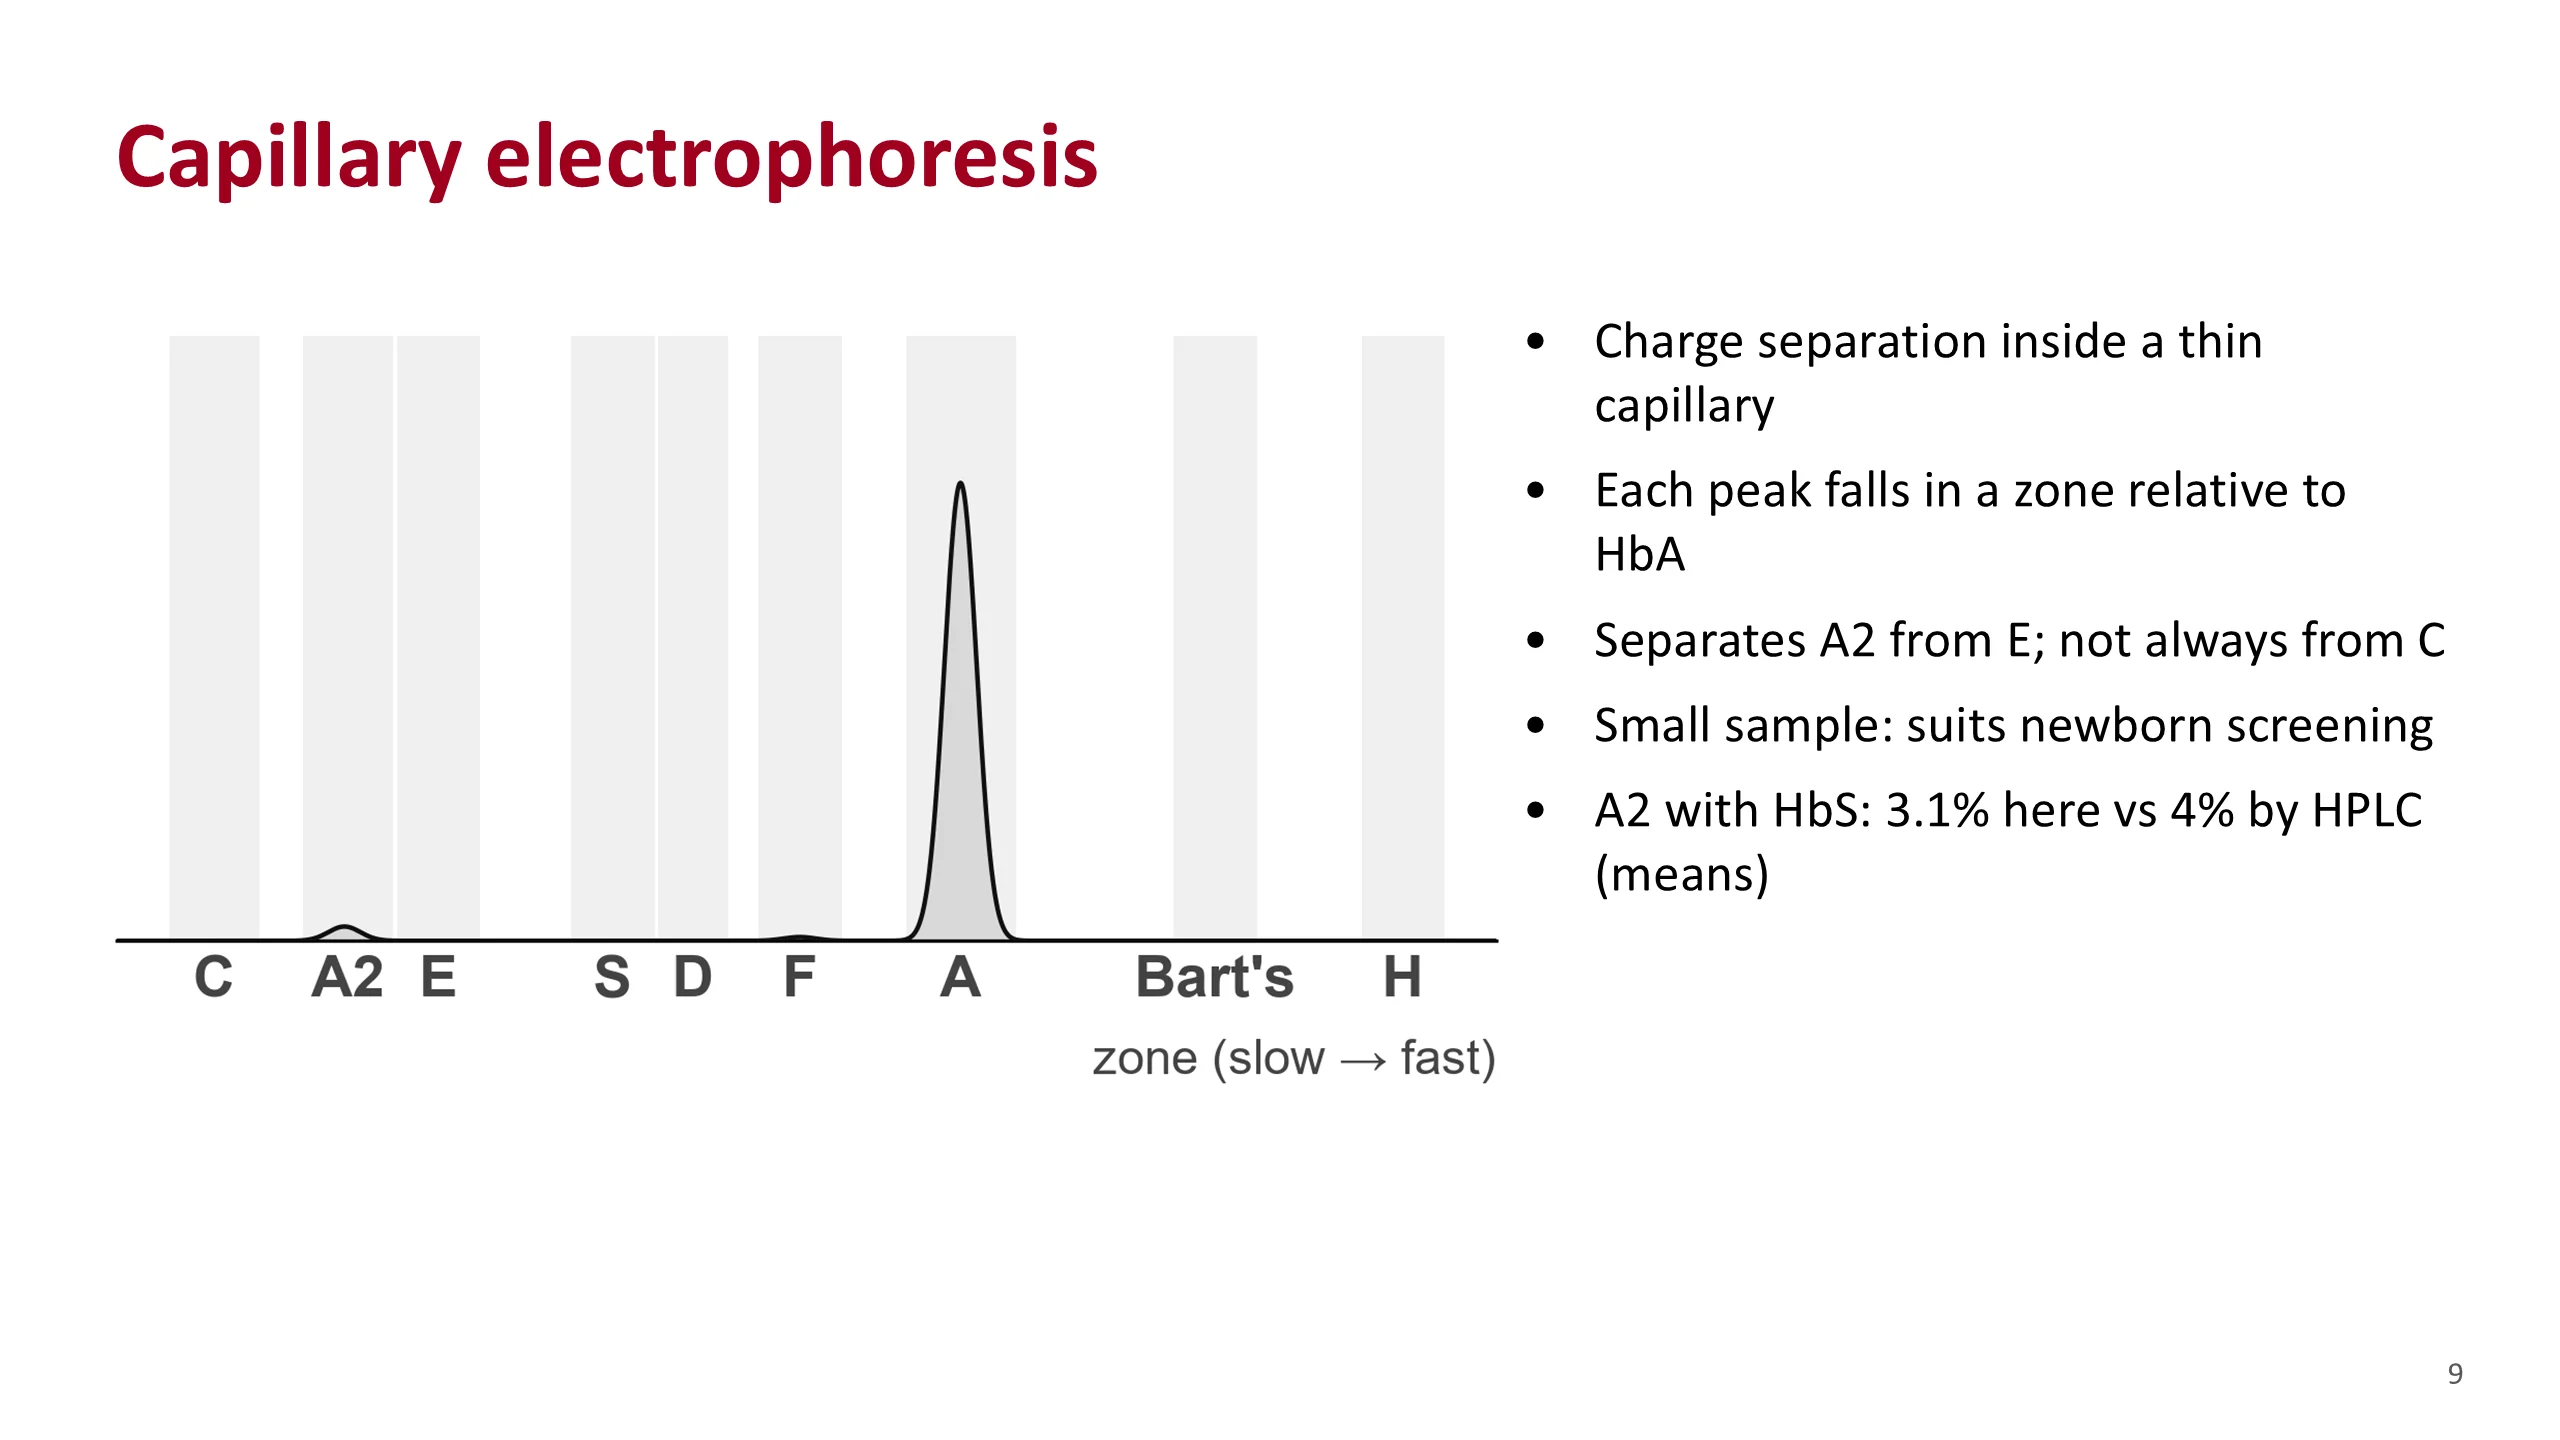
Capillary electrophoresis is the modern form of electrophoresis, without the gel. The separation is by charge in an alkaline buffer, but it happens inside a very thin tube, so it is fast and uses high voltage. A detector at the end draws peaks.
The machine places each peak in a zone, defined by its distance from HbA. The drawing shows the zones in order of how fast the hemoglobins move. On a real report, read the label on each peak rather than trusting its position on the screen.
It has three useful strengths. It separates A2 from E, which some HPLC instruments cannot. It needs a very small sample, so it suits newborn screening. And it can suspect Hb Bart's and Hb H.
Its weakness is HbC, which does not always separate from A2.
The two methods do not give exactly the same A2. In samples with HbS, one study found a mean A2 of 3.1% by capillary electrophoresis and 4% by HPLC. This is one reason not to make too much of a small A2 rise in a sickle patient.
The Saudi premarital programme has used capillary electrophoresis, HPLC, or both.
Sources. Bain, Haemoglobinopathy Diagnosis, 3rd edition, 2020, chapter 2. Aljabry et al., J Epidemiol Glob Health 2024, for the methods used in the premarital programme.
A reading routine
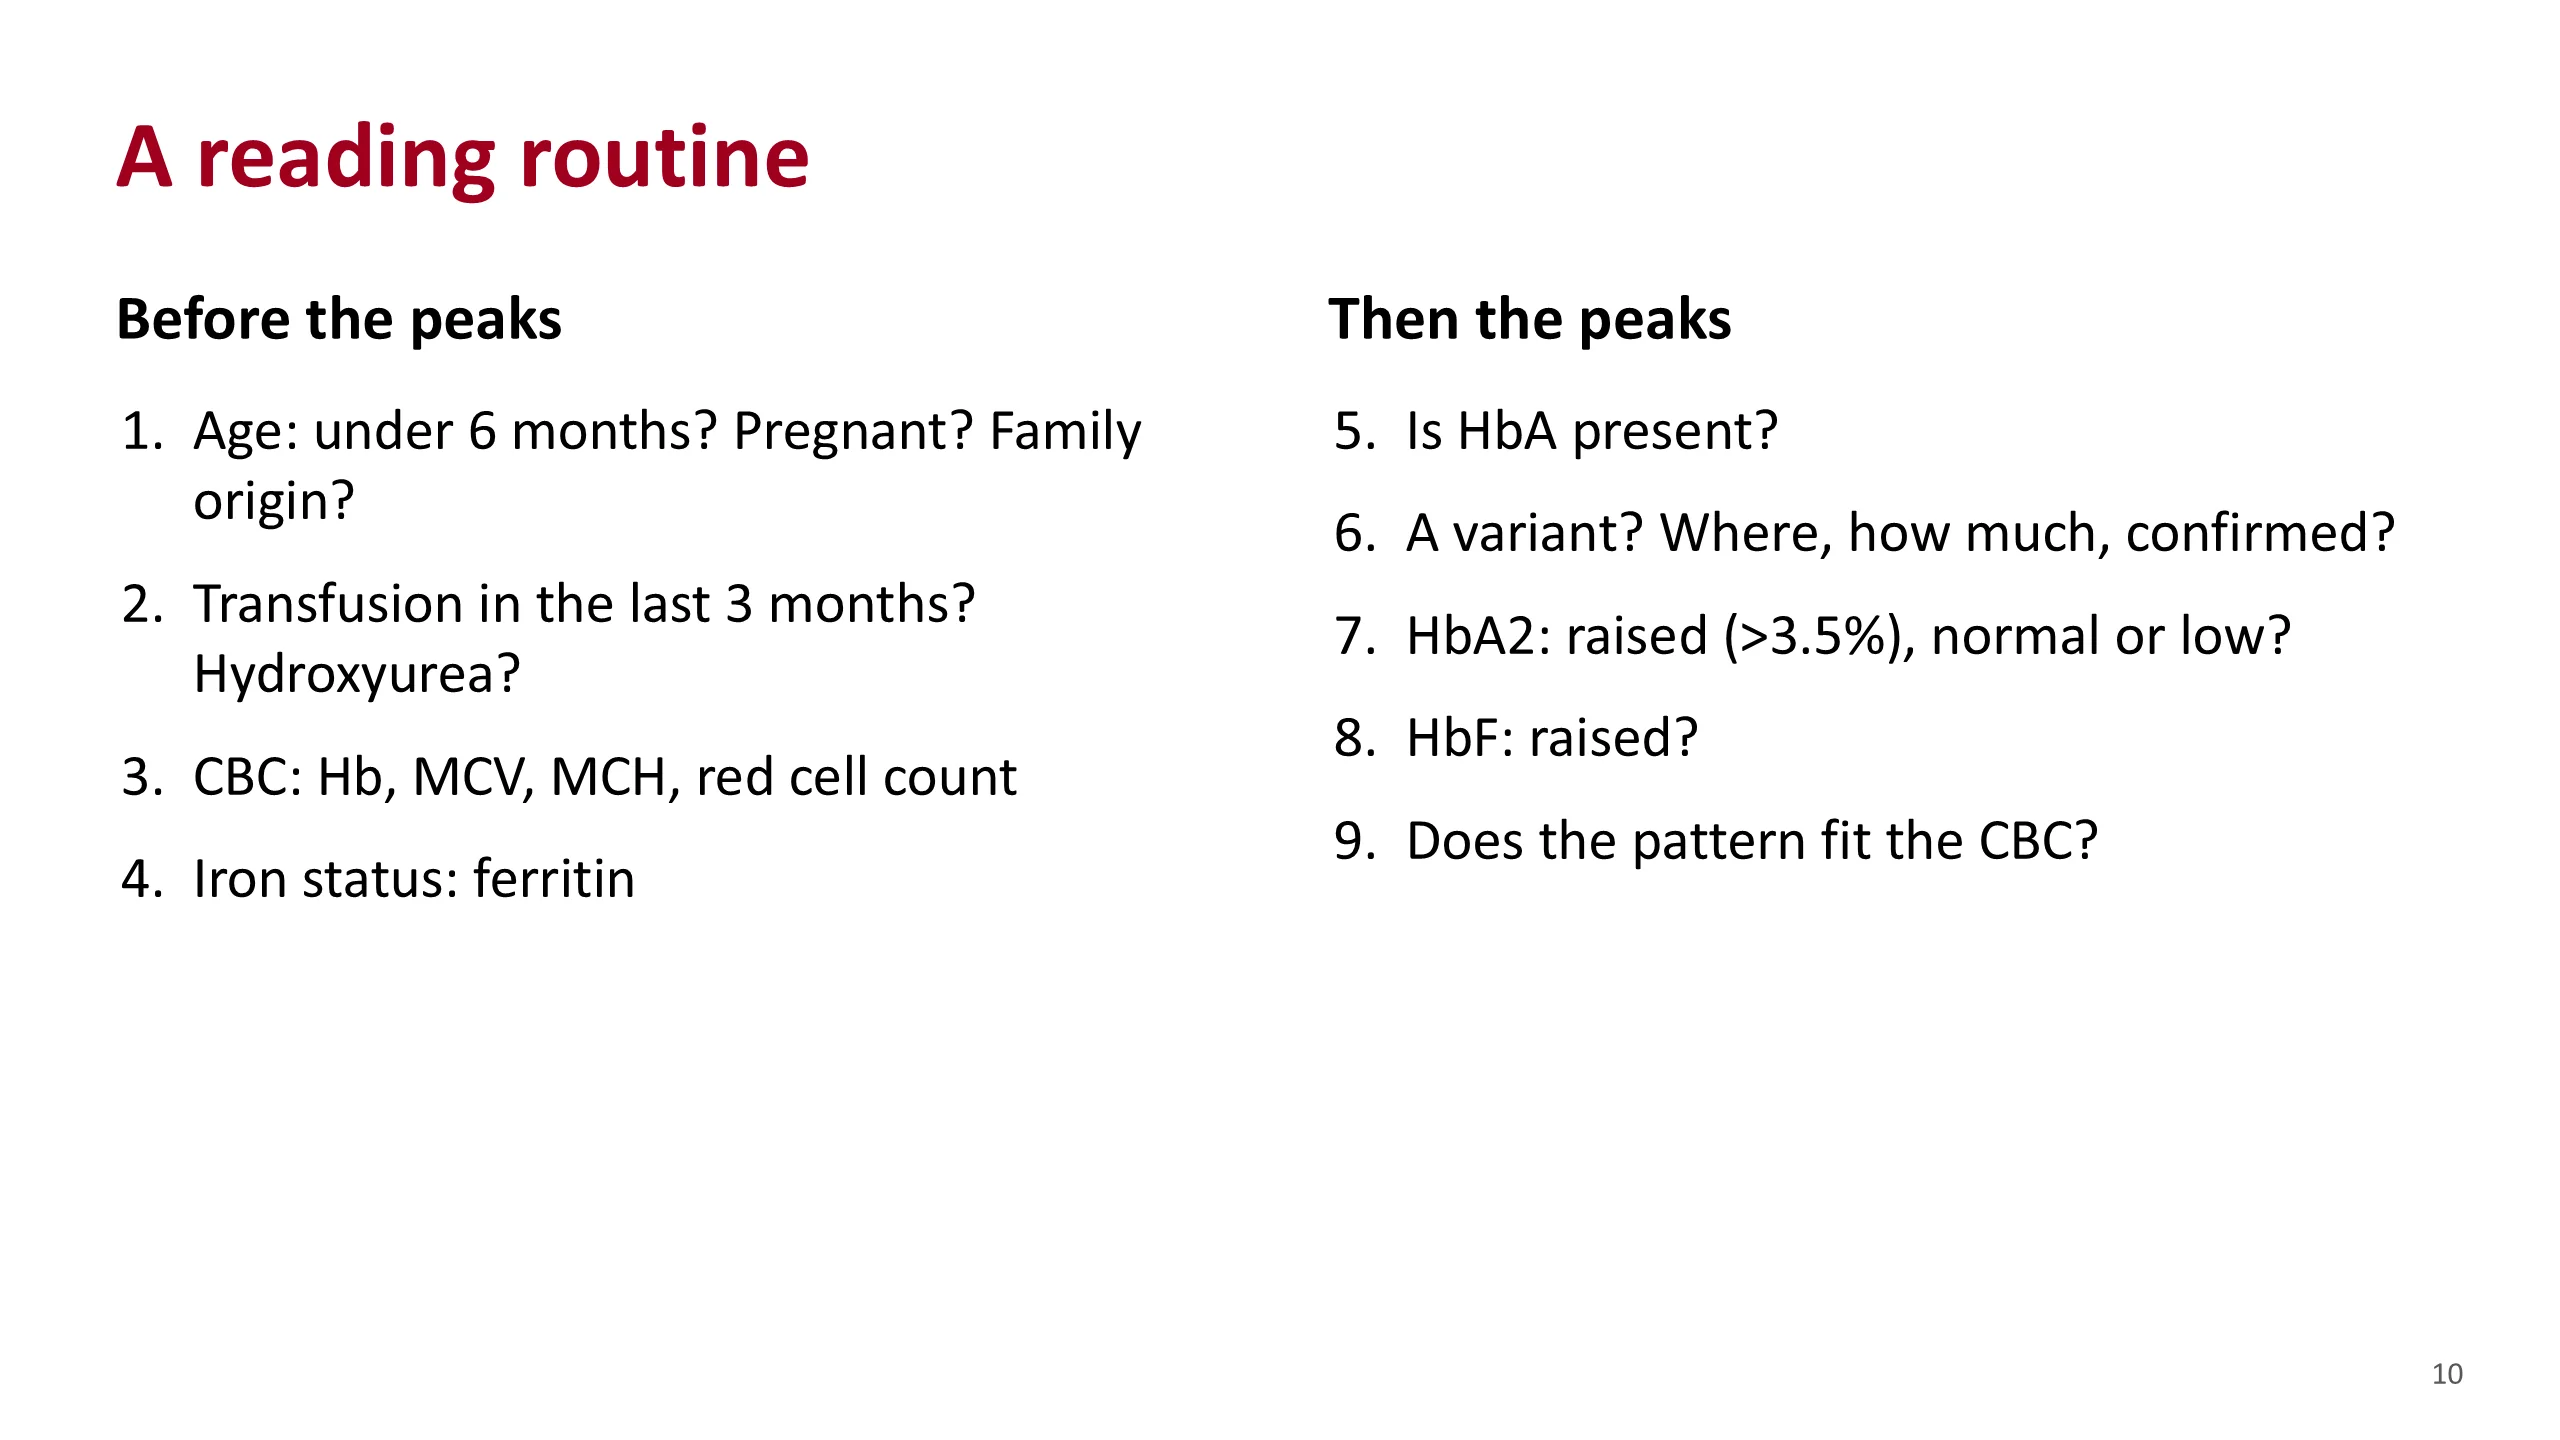
This is the routine. Use the same order every time, and most mistakes disappear.
First, the patient. How old? Under six months, HbF is still high and a beta disorder can hide. Where is the family from? Is she pregnant?
Second, what has changed the blood. A transfusion in the last three months puts donor HbA into the sample. Hydroxyurea raises HbF.
Third, the blood count. Hemoglobin, MCV, MCH and the red cell count. A low MCV with a high red cell count suggests thalassemia trait.
Fourth, iron. Iron deficiency lowers HbA2 and can hide beta-thalassemia trait.
Only now look at the peaks. Is HbA present? If not, no normal beta chain is being made. Is there a variant? Where does it run, how much is there, and has it been confirmed by a second method? Is A2 raised above 3.5%, normal, or low? Is F raised?
Last, step back. Does the pattern fit the blood count? If it does not, ask why before you sign it off.
The three questions in Anemia Part 3, is HbA there, is there a new peak, is A2 raised, are steps five to seven of this list.
Sources. Hematology Handbook, chapter 6. Anemia Part 3, slide 13.
Thalassemia patterns
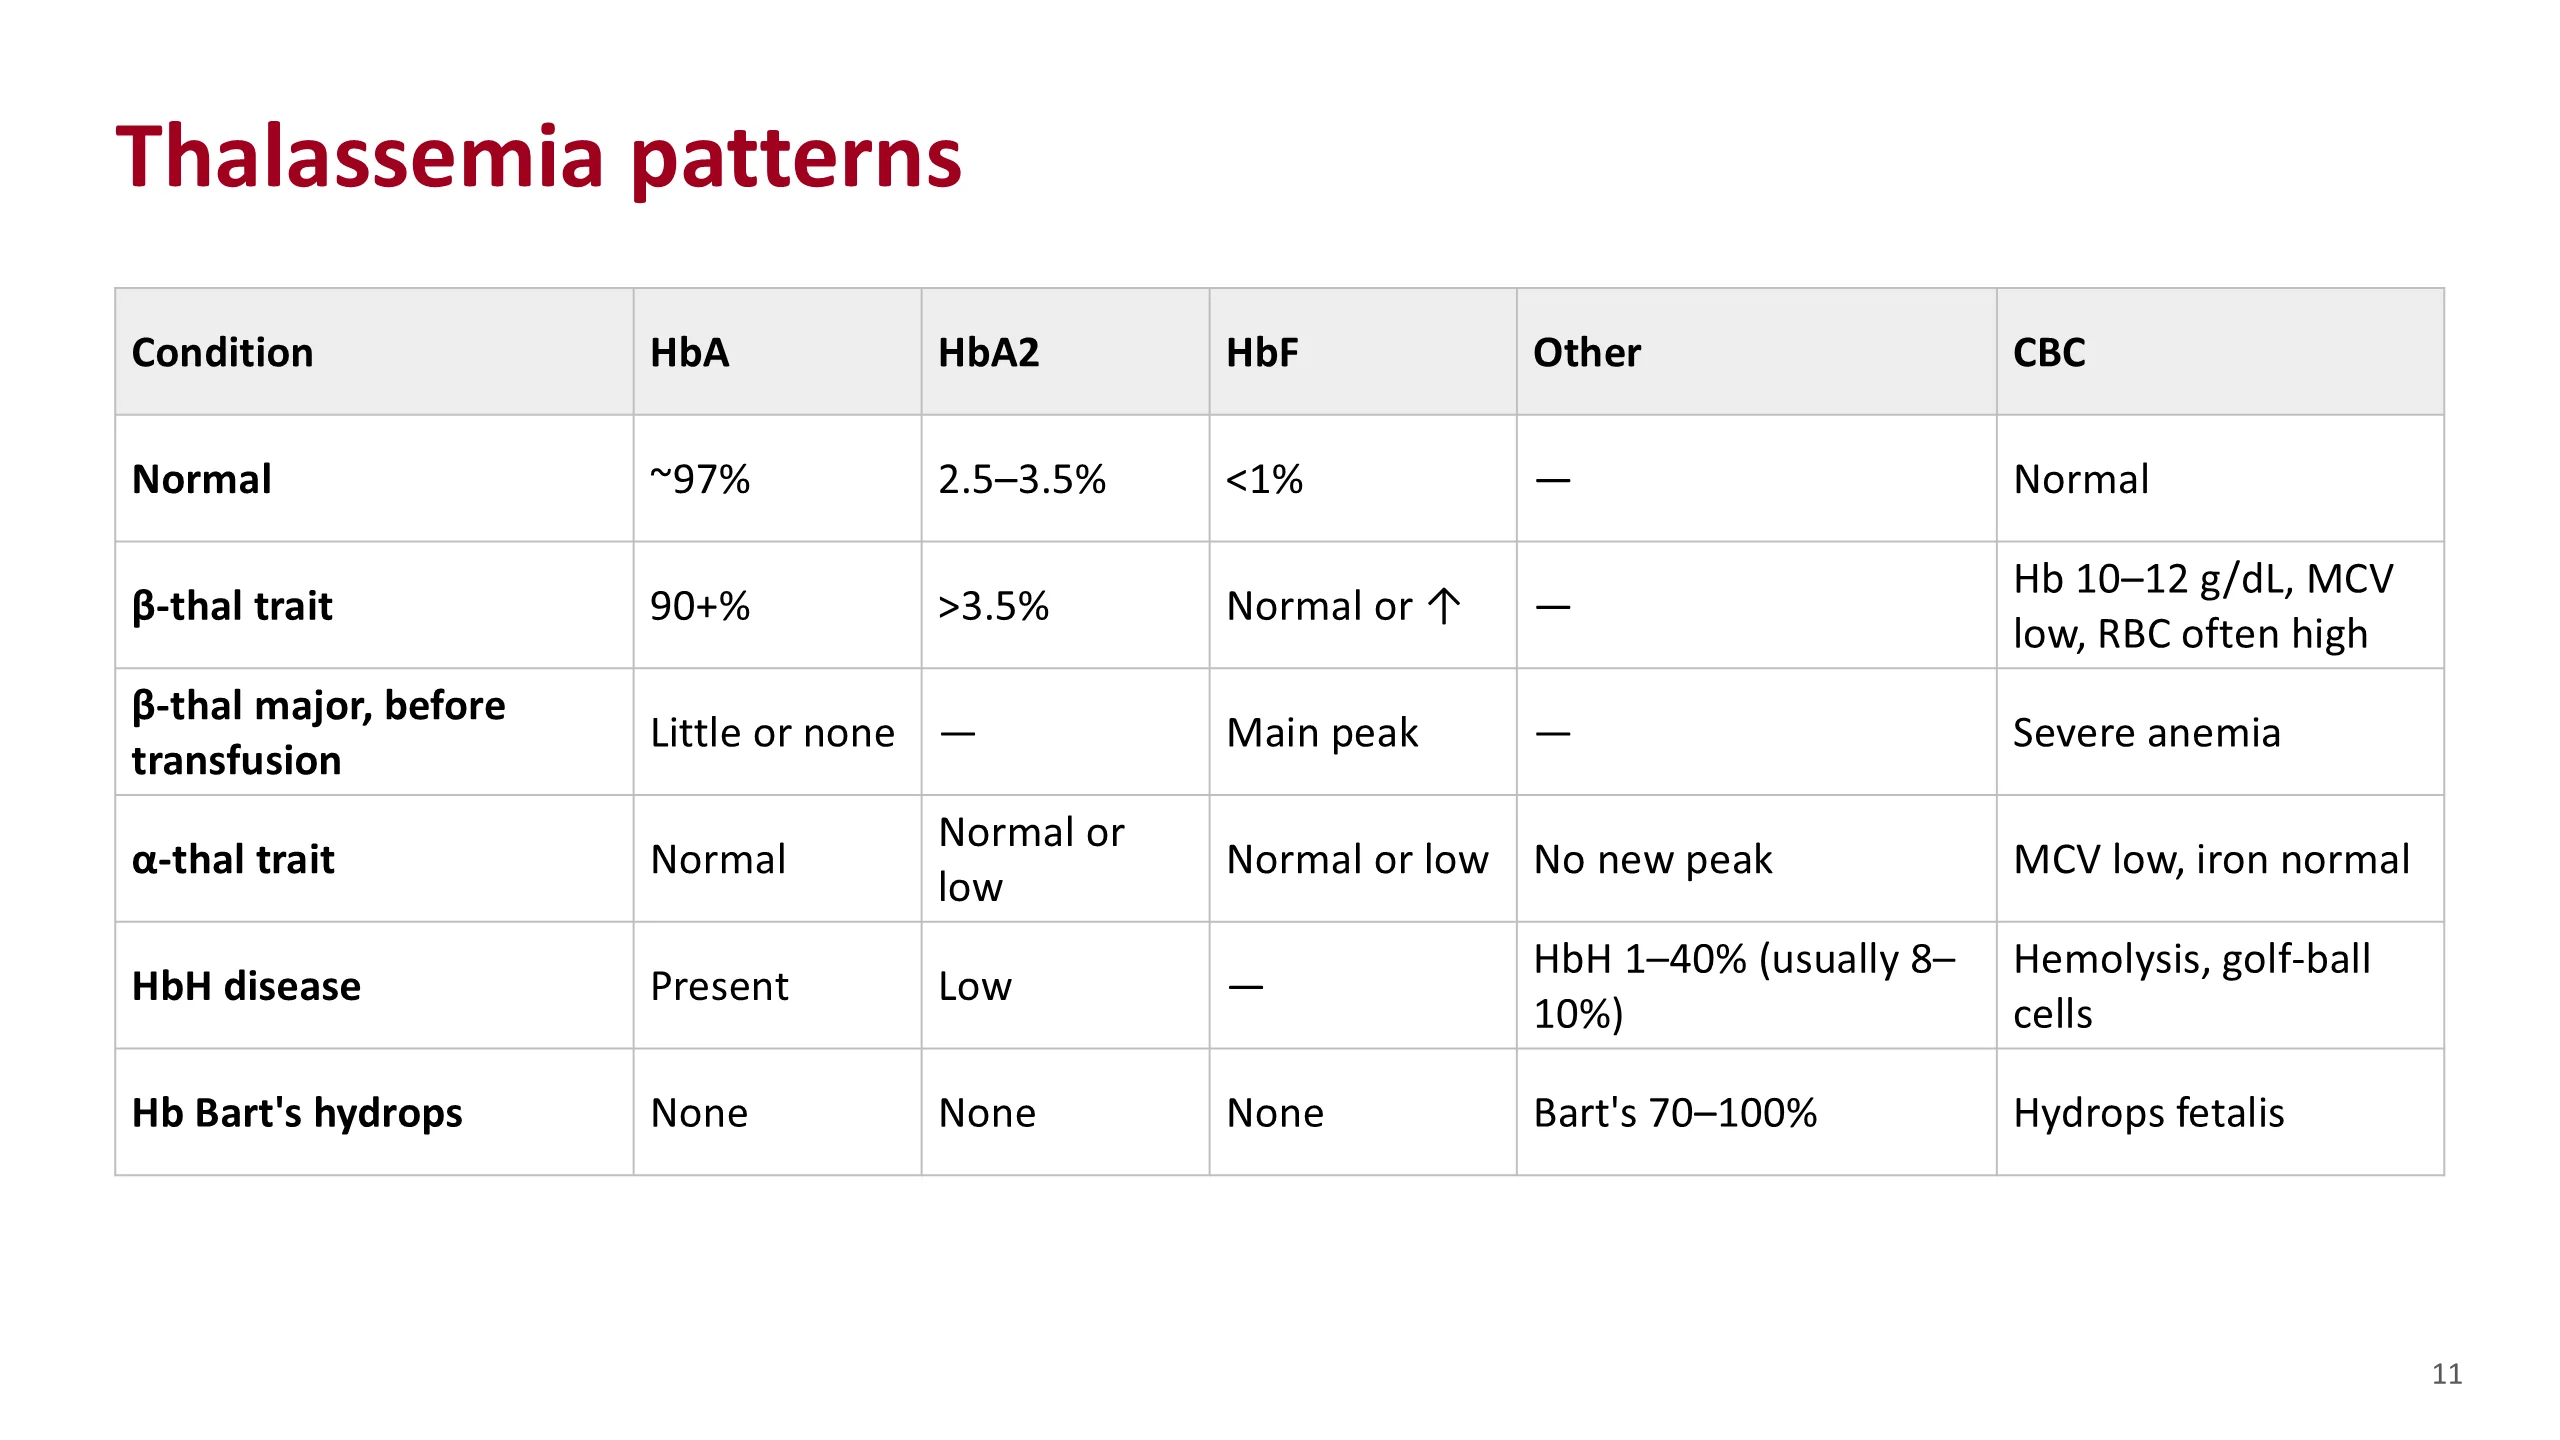
Thalassemia is a quantity problem, so you do not look for a new peak. You look at the proportions, and at the blood count.
Beta-thalassemia trait: HbA is still 90% or more, HbA2 is above 3.5%, and HbF may be a little raised or normal. The hemoglobin is mildly low, 10 to 12 g/dL in the handbook, the MCV is low and the red cell count is often high.
Beta-thalassemia major, before any transfusion: with little or no beta chain, little or no HbA can form, and HbF is the main peak. Once the child is on regular transfusions, most of the HbA on the report is donor blood.
Alpha-thalassemia trait: the pattern is normal, or A2 is low-normal. All three hemoglobins need alpha chains, so they fall together and the proportions do not change. A normal result does not exclude it. It is a diagnosis of exclusion: a small-cell anemia, normal iron, a normal pattern. DNA testing confirms it when it matters, for example before marriage.
HbH disease: three alpha genes are lost. Spare beta chains form HbH, which shows as an extra fast peak, usually 8 to 10% but anywhere from 1 to 40%. A2 is low. A supravital stain shows golf-ball cells.
Hb Bart's hydrops: all four alpha genes are lost. There is no HbA, A2 or F, because all need alpha chains. Bart's is 70 to 100%. The baby is hydropic.
Sources. Hematology Handbook, chapters 6 and 15, and Anemia Part 3, slide 15, for the first four rows. Bain, Haemoglobinopathy Diagnosis, 3rd edition, 2020, chapter 3, for the HbH and Hb Bart's percentages.
Sickle patterns
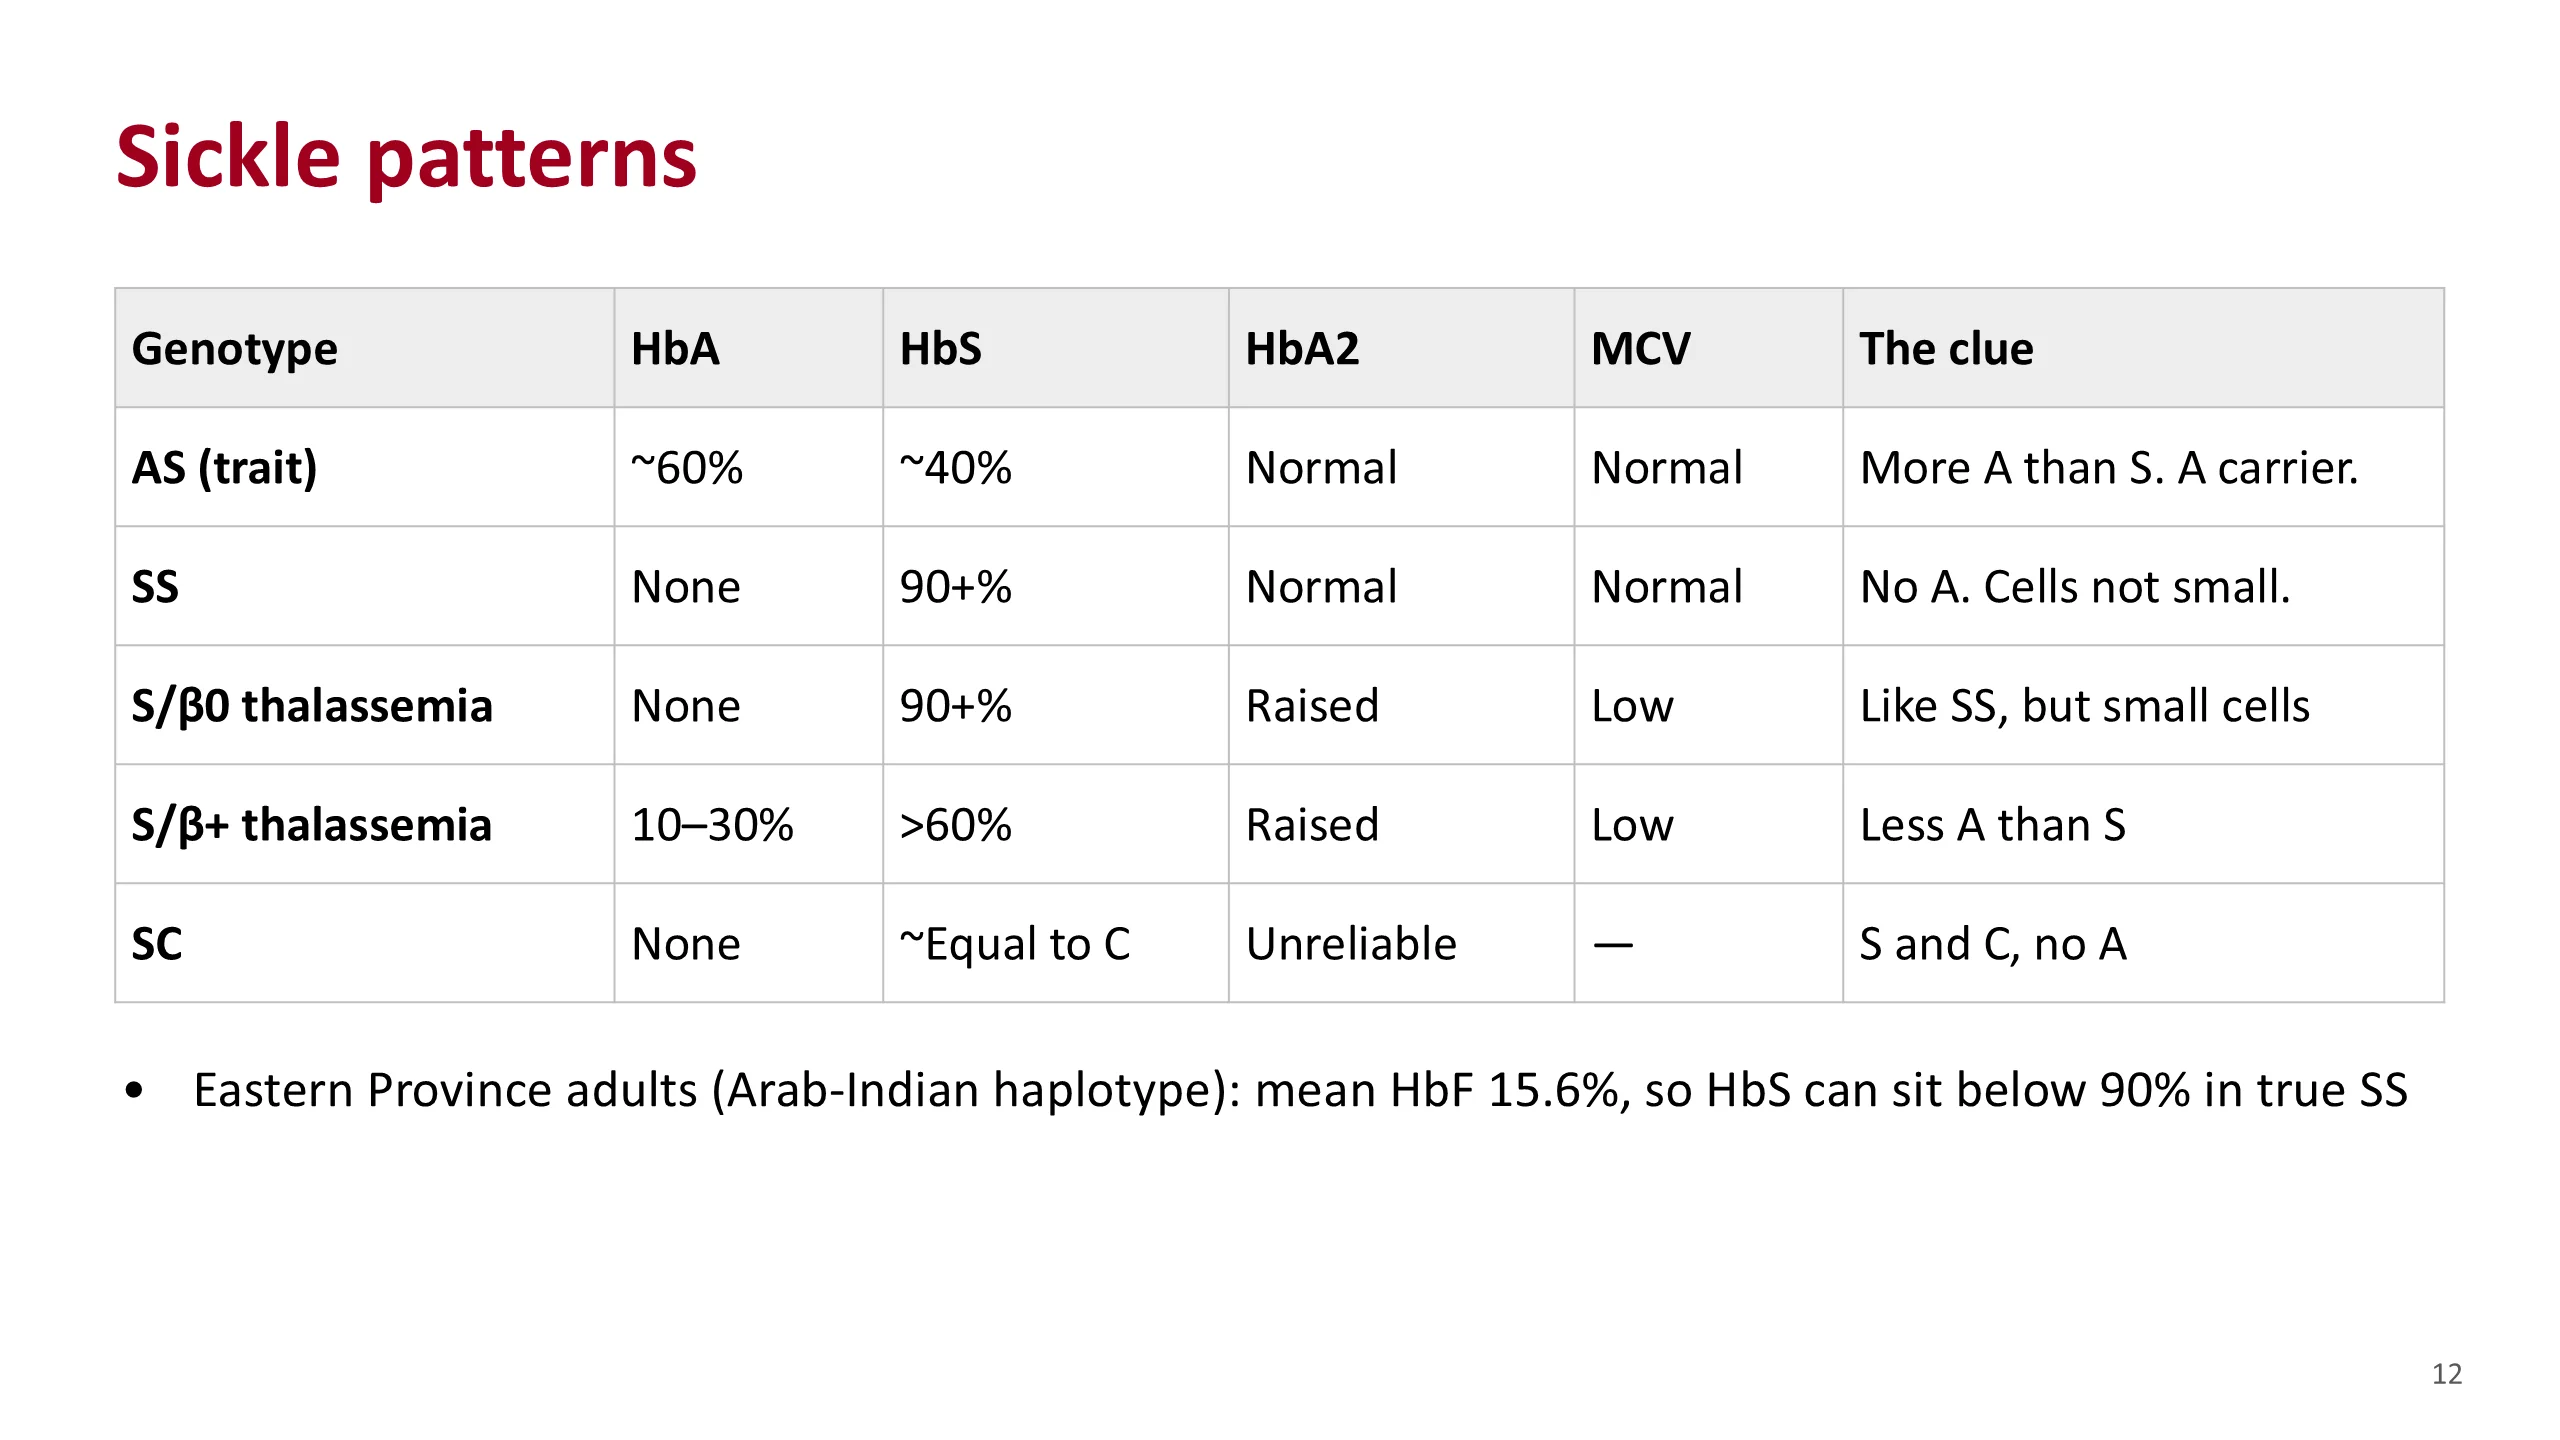
For the sickle patterns, the first question is always the same. Is HbA there?
Sickle trait, AS: one normal beta gene and one sickle gene. There is more HbA than HbS, about 60% and 40%. The blood count is normal. This is a carrier, not a patient. If the patient also has alpha-thalassemia trait, the HbS fraction is lower than usual.
SS: both beta genes carry the sickle mutation, so no HbA can be made. HbS is 90% or more and the cells are not small.
S/beta-zero thalassemia: one sickle gene and one beta-thalassemia gene that makes no beta chain. There is no HbA, so on HbA alone it looks like SS. The clues are small cells with normal iron, and a raised A2. Do not lean on A2 alone: in SS it can run a little above 3.5%, and HPLC reads A2 high when HbS is present.
S/beta-plus thalassemia: the thalassemia gene still makes some beta chain, so some HbA appears, but less than HbS. A2 is raised, the cells are small and the disease is usually milder. Less A than S separates it from trait.
HbSC: one S gene and one C gene. S and C are present in roughly equal amounts and there is no HbA. A2 cannot be read reliably: on capillary electrophoresis C does not always separate from A2, and on HPLC modified S falls in the A2 window.
The Saudi point. HbF varies a great deal. In 104 adults from Al-Ahsa in the Eastern Province with the Arab-Indian haplotype, the mean HbF was 15.6%. HbF takes up part of the total, so HbS can sit below 90% in a patient who still has SS. That figure does not apply to patients from the south-west, who mostly carry African haplotypes.
Sources. Hematology Handbook, chapter 6, for AS, SS and S/beta-zero. Anemia Part 3, slide 14, for the S/beta-plus HbA of 10 to 30%, which that slide credits to ASH-SAP, 7th edition. Bain, Haemoglobinopathy Diagnosis, 3rd edition, 2020, chapter 4, for HbSC, for A2 in SS, and for alpha-thalassemia lowering HbS in trait. Alsultan et al., Br J Haematol 2014, for HbF.
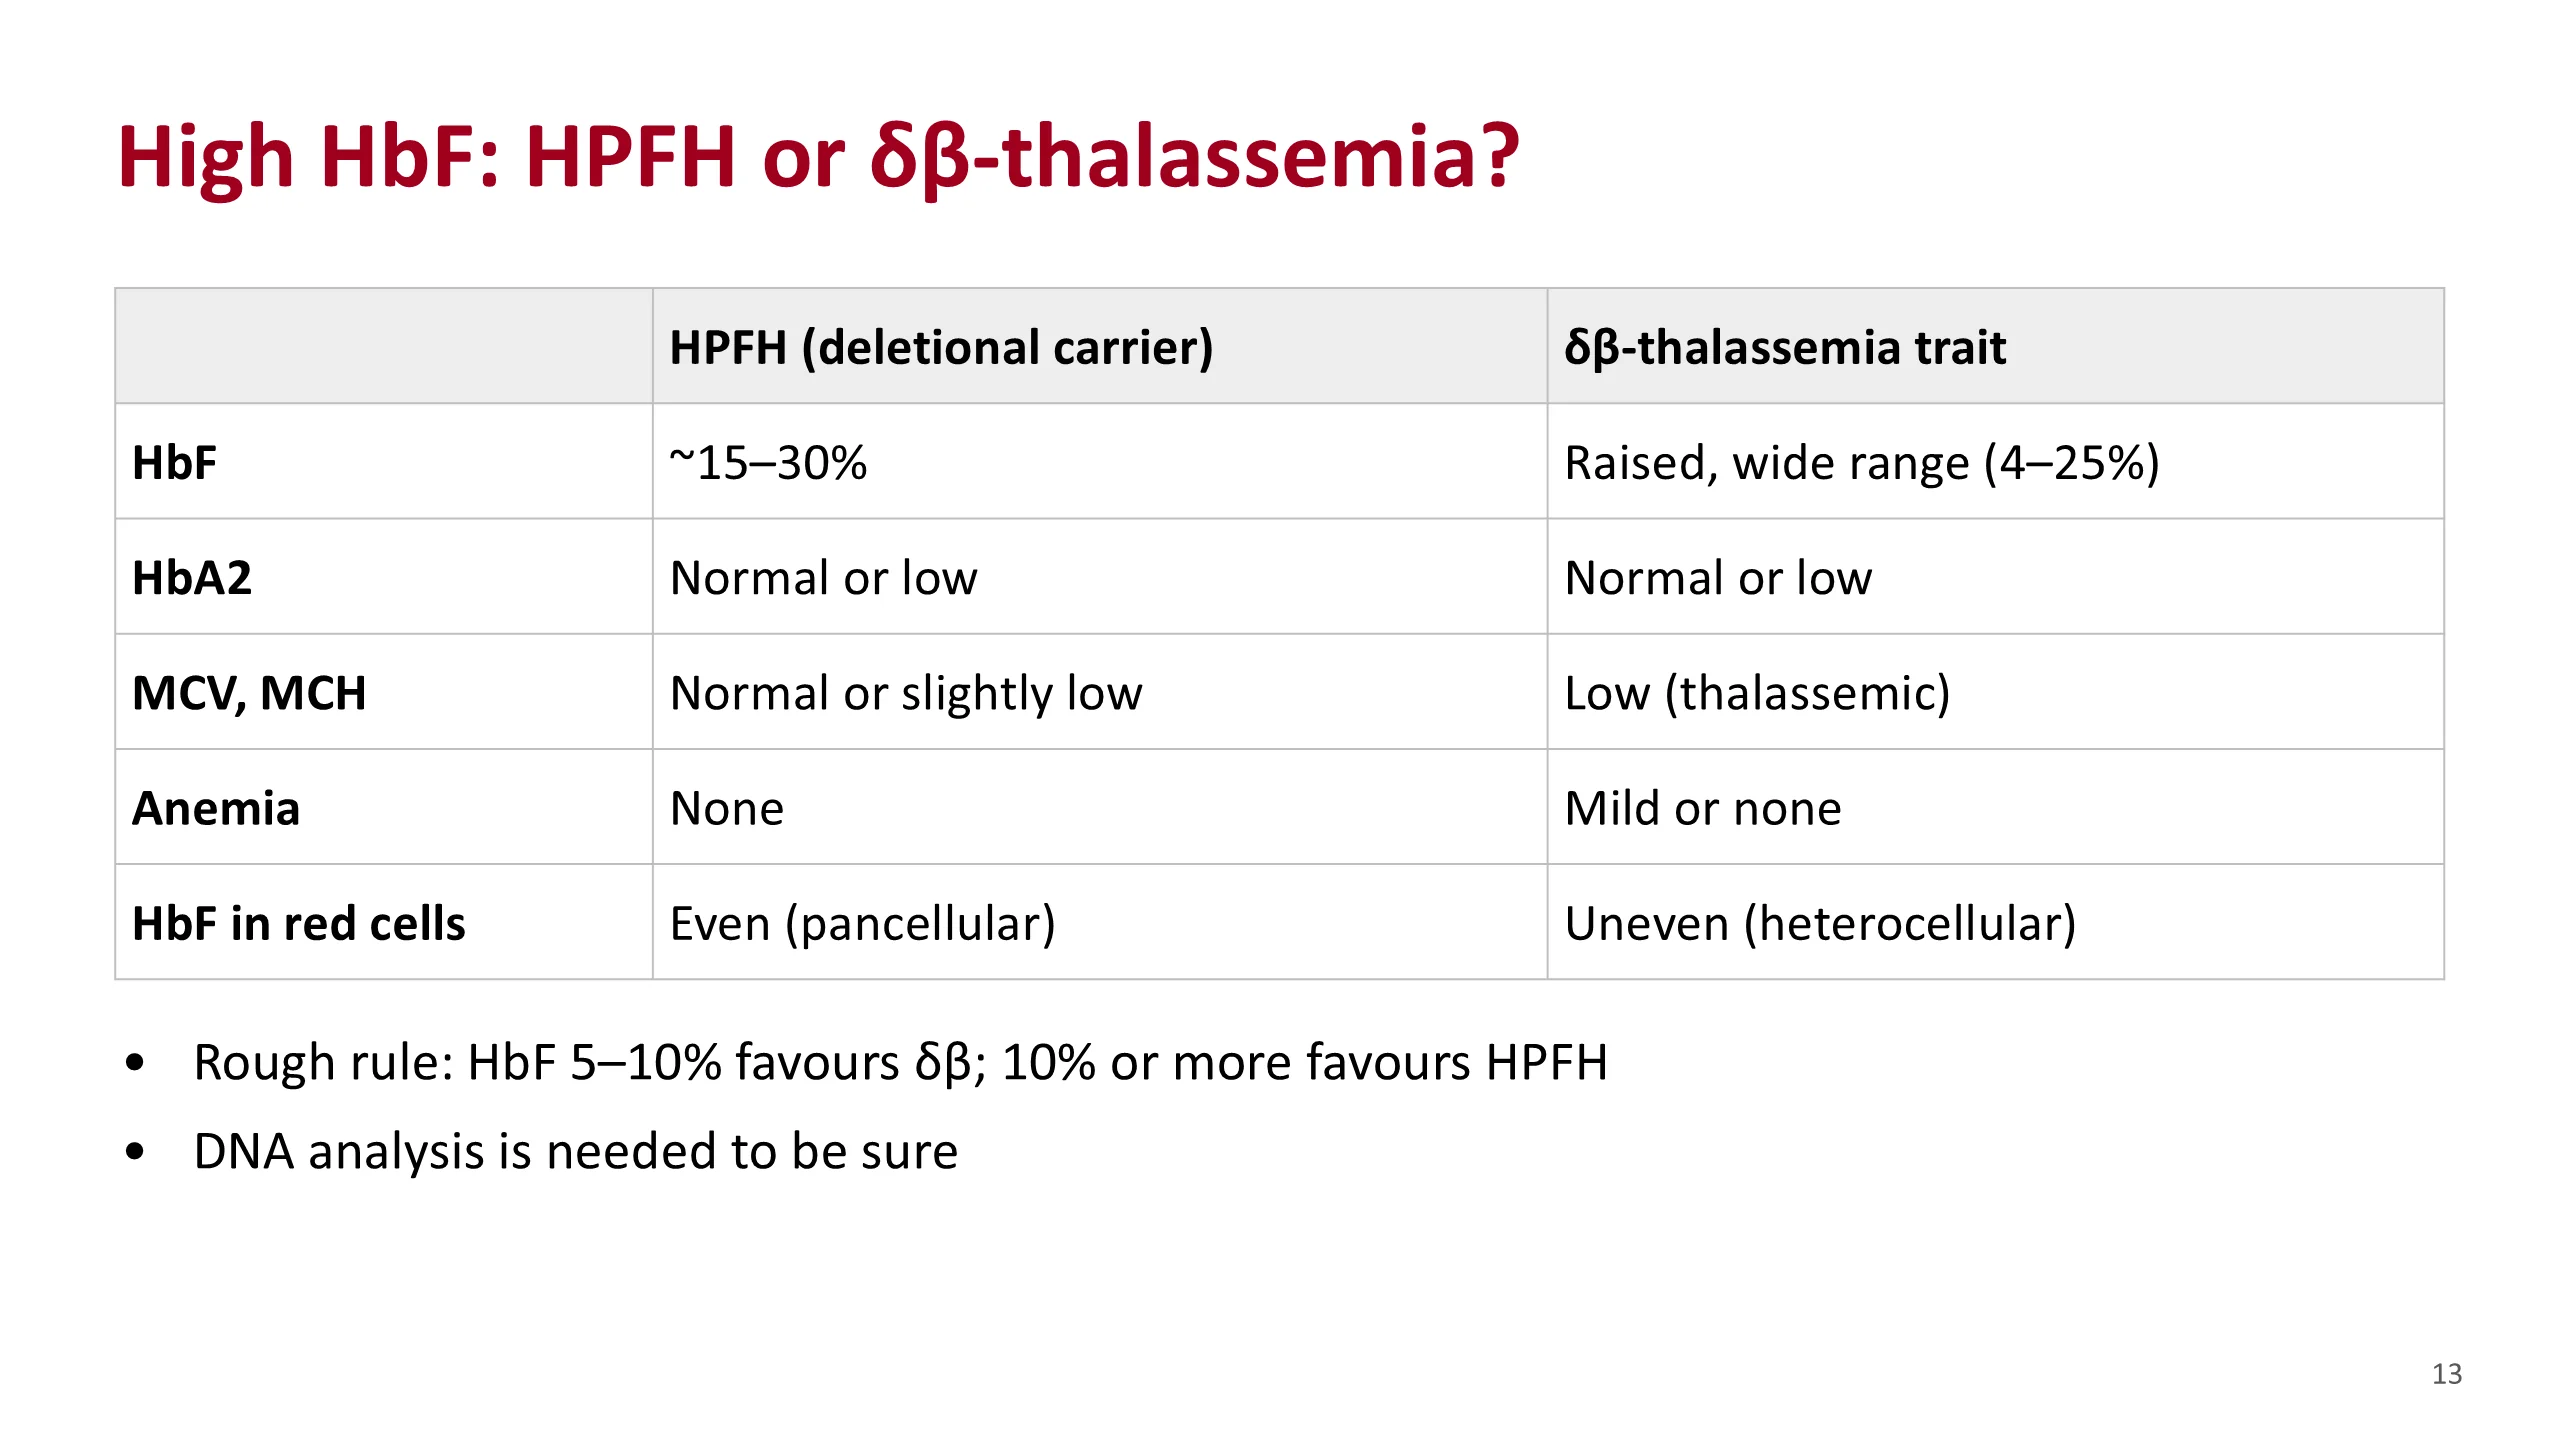
High HbF: HPFH or δβ-thalassemia?
Sometimes the only finding is a raised HbF in an adult. Two inherited conditions cause this on their own, and they are told apart mainly by the blood count.
Hereditary persistence of fetal hemoglobin, HPFH, is a harmless carrier state. In the deletional types, carriers have an HbF of roughly 15 to 30%, depending on the deletion. A2 is normal or low. There is no anemia and the indices are normal or only a little low. The HbF is spread evenly across the red cells, called pancellular.
Delta-beta thalassemia trait behaves like a thalassemia. The indices are thalassemic: small cells, low MCH, often a high red cell count. HbF is raised, across a wide range, and A2 is normal or low. The HbF sits in some cells and not others, called heterocellular.
Bain gives a rough screening rule: an HbF between 5 and 10% is more likely delta-beta thalassemia, and 10% or more is more likely HPFH. That is a guide, not a diagnosis. If the patient also has alpha-thalassemia, an HPFH carrier can have abnormal indices too. DNA analysis is needed to be sure.
Before either diagnosis, rule out the common causes of a raised HbF: beta-thalassemia, sickle cell disease, hydroxyurea, and age under one year.
Source. Bain, Haemoglobinopathy Diagnosis, 3rd edition, 2020, chapter 3, tables 3.14 and 3.15, figure 3.56 and the screening flow chart in chapter 7.
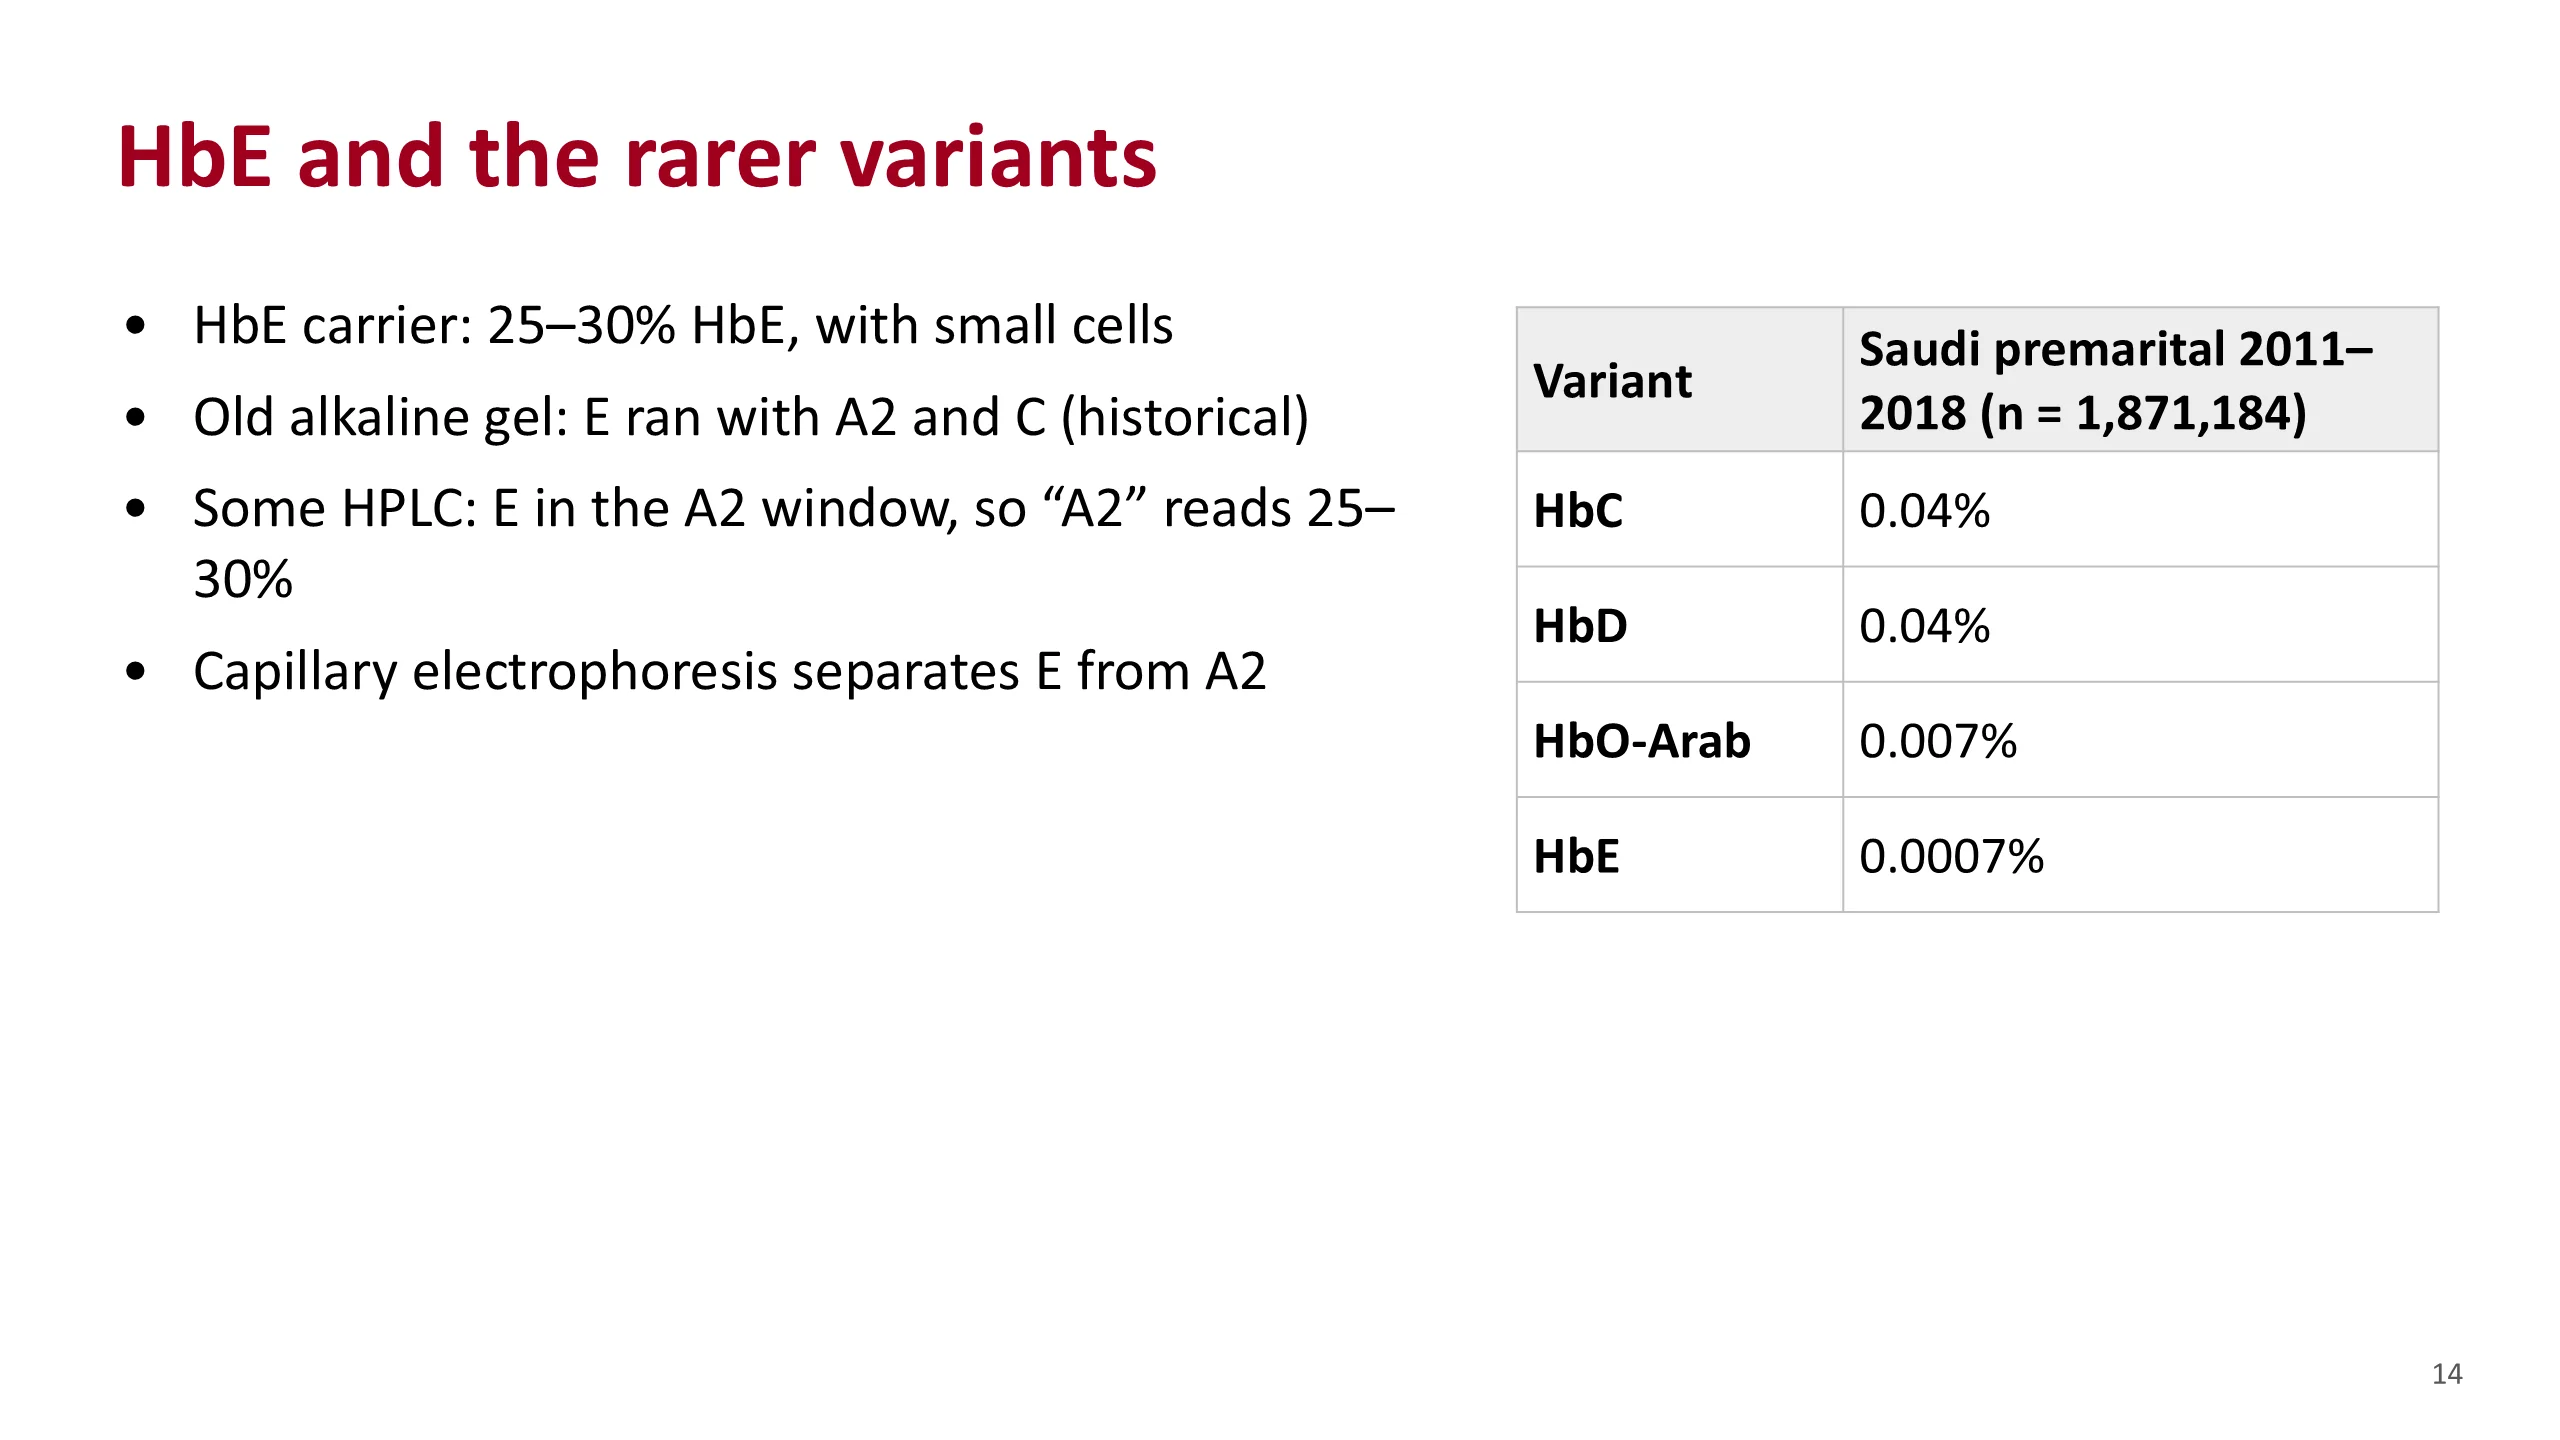
HbE and the rarer variants
HbE is a beta-chain variant. It is a qualitative change, but it is also made in reduced amount, so carriers have small cells, like a thalassemia trait. A carrier usually has 25 to 30% HbE.
HbE is a good test of whether you know your methods. On the old alkaline gel it ran with A2 and C, which is why older books group them. On some HPLC instruments it comes off in the A2 window, so the report shows an A2 of around 25 to 30%. No beta-thalassemia trait has an A2 that high. When you see it, think of a variant in the A2 window, and confirm by capillary electrophoresis or another method.
In Saudi Arabia these variants are rare among people screened before marriage. In 1,871,184 people tested from 2011 to 2018, HbC and HbD were each found in 0.04%, HbO-Arab in 0.007% and HbE in 0.0007%. HbC was concentrated in the western regions of Makkah and Al Madinah, and HbD was highest in Tabuk.
So in this country a peak in the S window is usually HbS, but not always, and an odd A2 should make you ask where the family is from.
Sources. Bain, Haemoglobinopathy Diagnosis, 3rd edition, 2020, chapters 2 and 5, for HbE. Aljabry et al., J Epidemiol Glob Health 2024, for the Saudi frequencies.
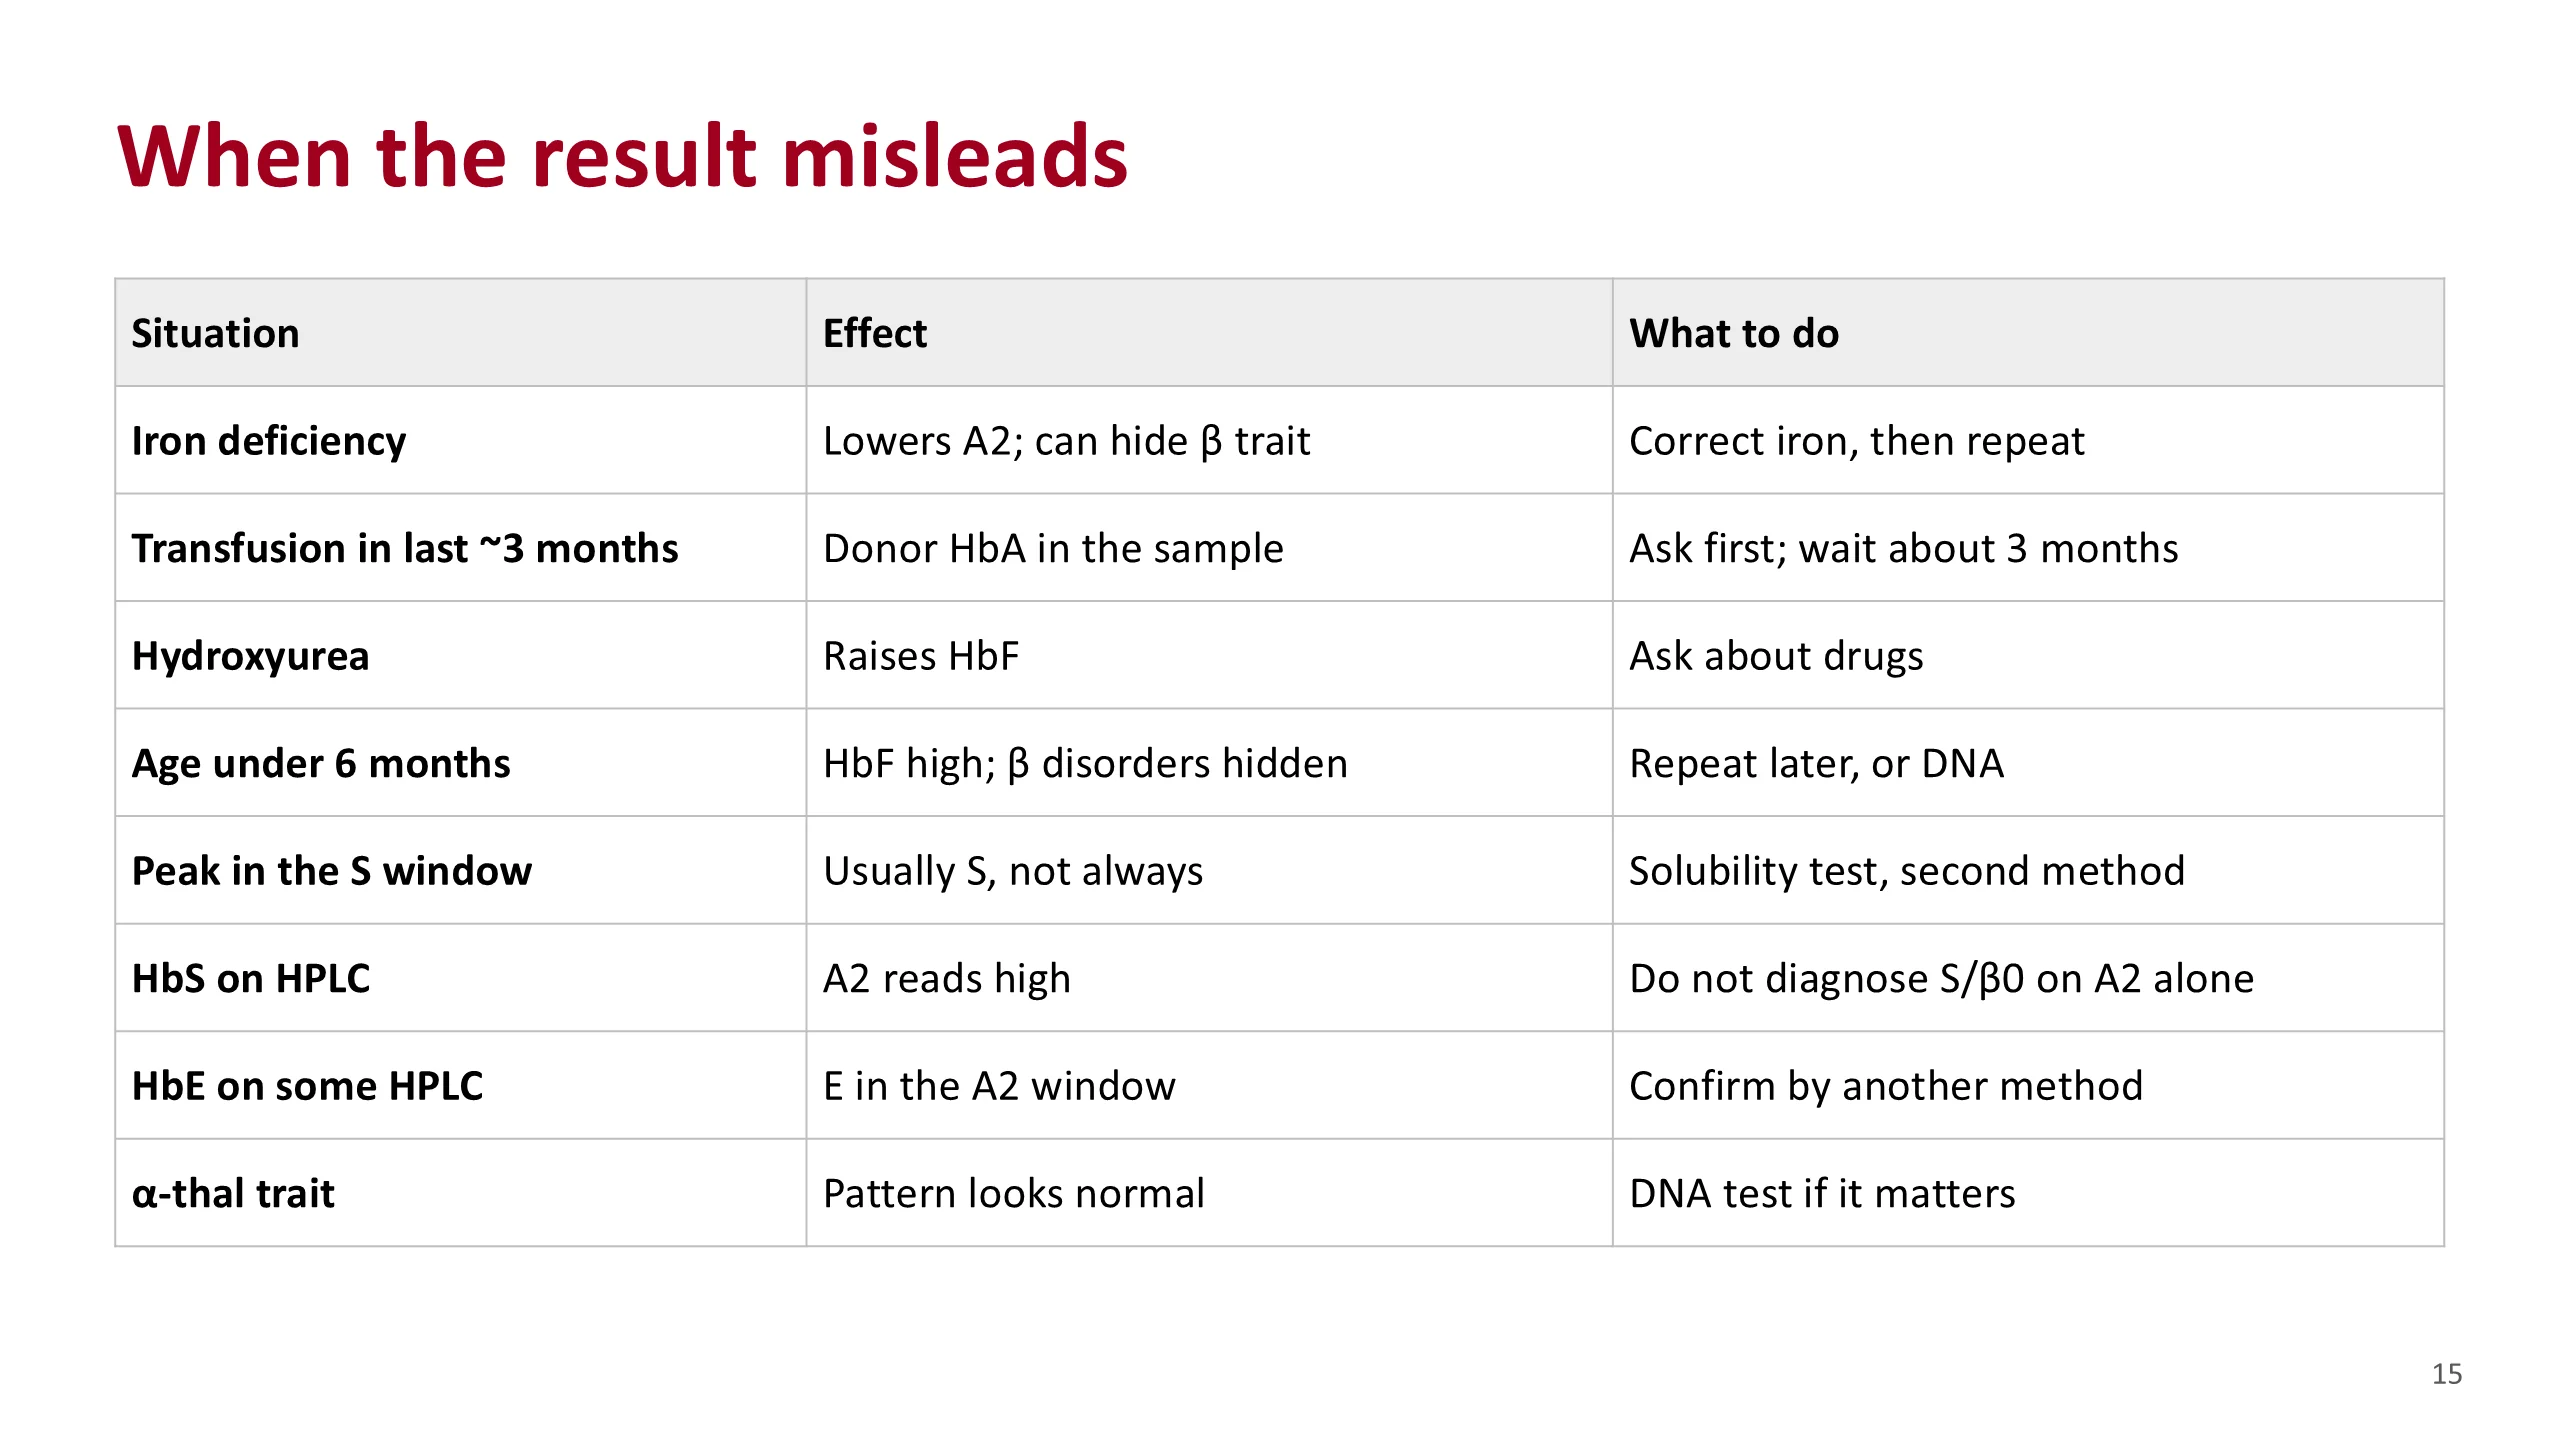
When the result misleads
These are the situations that change the reading. Most of them are caught by the first four steps of the routine.
Iron deficiency lowers HbA2 and can pull it back into the normal range, hiding a beta-thalassemia trait. Correct the iron, then repeat the test if the indices do not return to normal.
A transfusion adds donor HbA. A patient with SS can then appear to have HbA. Ask before you read. The handbook advises waiting about three months.
Hydroxyurea raises HbF. A sickle patient on it will have a higher HbF than his genotype alone explains.
Under six months, HbF is still high and beta disorders can be missed.
A peak in the S window is usually HbS, but other variants can share it. Confirm with a solubility test and a second method. On the old alkaline gel, D and G ran with S, which is where this rule began.
HbS on HPLC makes A2 read a little high, so do not diagnose S/beta-zero on A2 alone.
HbE on some HPLC instruments falls in the A2 window.
Alpha-thalassemia trait gives a normal pattern. A normal result does not exclude it.
And in sickle trait, coexisting alpha-thalassemia lowers the HbS percentage.
Sources. Hematology Handbook, chapter 6, for iron deficiency, transfusion, hydroxyurea, age and the S peak. Bain, Haemoglobinopathy Diagnosis, 3rd edition, 2020, chapters 2 and 3, for the HPLC effects of HbS and HbE, for retesting after iron, and for alpha-thalassemia in sickle trait.
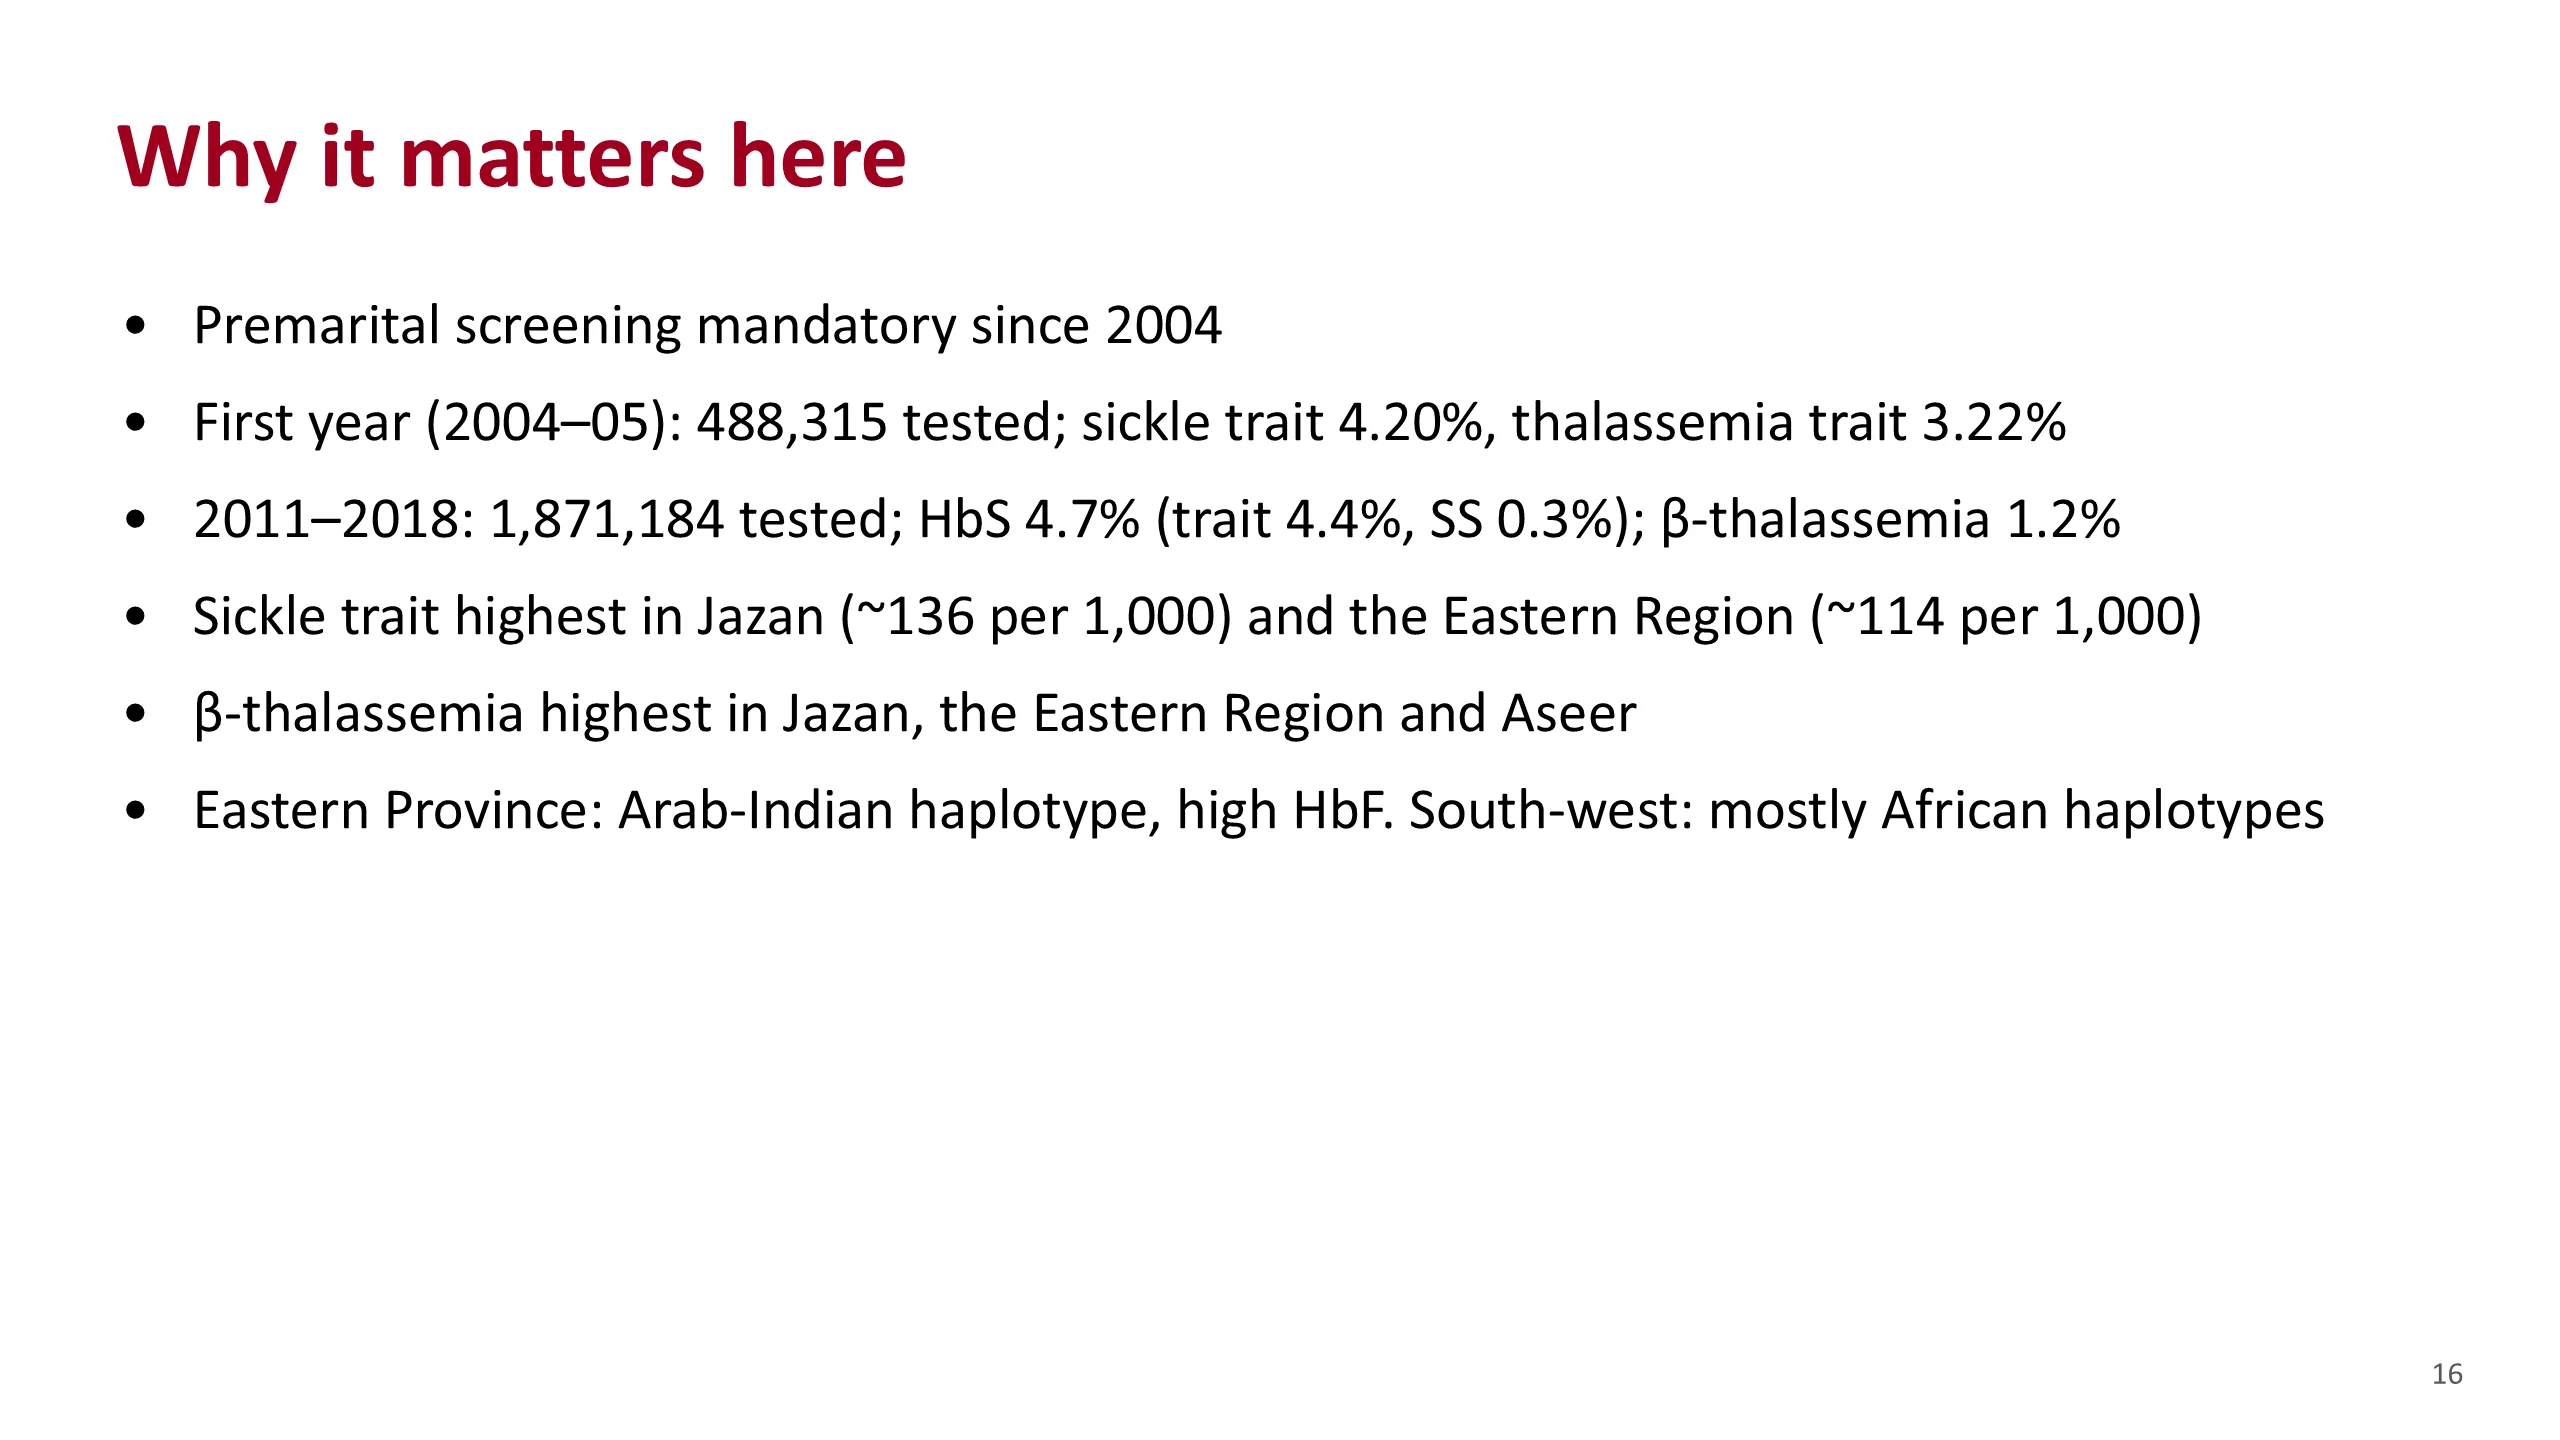
Why it matters here
These numbers explain why you will read so many of these reports.
Premarital screening for sickle cell disease and thalassemia became mandatory in 2004. In the first year, from February 2004 to January 2005, 488,315 people were tested. 4.20% had sickle cell trait and 3.22% had thalassemia trait.
A later analysis covered 1,871,184 people tested from 2011 to 2018. HbS was found in 4.7%, mostly as trait, 4.4%. SS was found in 0.3%. Beta-thalassemia was found in 1.2%, almost all as trait. The two thalassemia figures are not directly comparable: different years, and the first-year figure counted thalassemia trait more broadly.
The burden is not even across the country. Sickle cell trait was highest in Jazan, about 136 per 1,000 people tested, and in the Eastern Region, about 114 per 1,000. Beta-thalassemia was highest in Jazan, the Eastern Region and Aseer, which is our own region.
The disease also differs by region. In the Eastern Province the sickle gene sits on the Arab-Indian haplotype, with high HbF. In the south-west it sits mostly on African haplotypes. A sickle patient from Al-Ahsa and one from Jazan may give quite different reports.
Sources. Alhamdan et al., Genet Med 2007. Aljabry et al., J Epidemiol Glob Health 2024. Alsultan et al., Br J Haematol 2014.
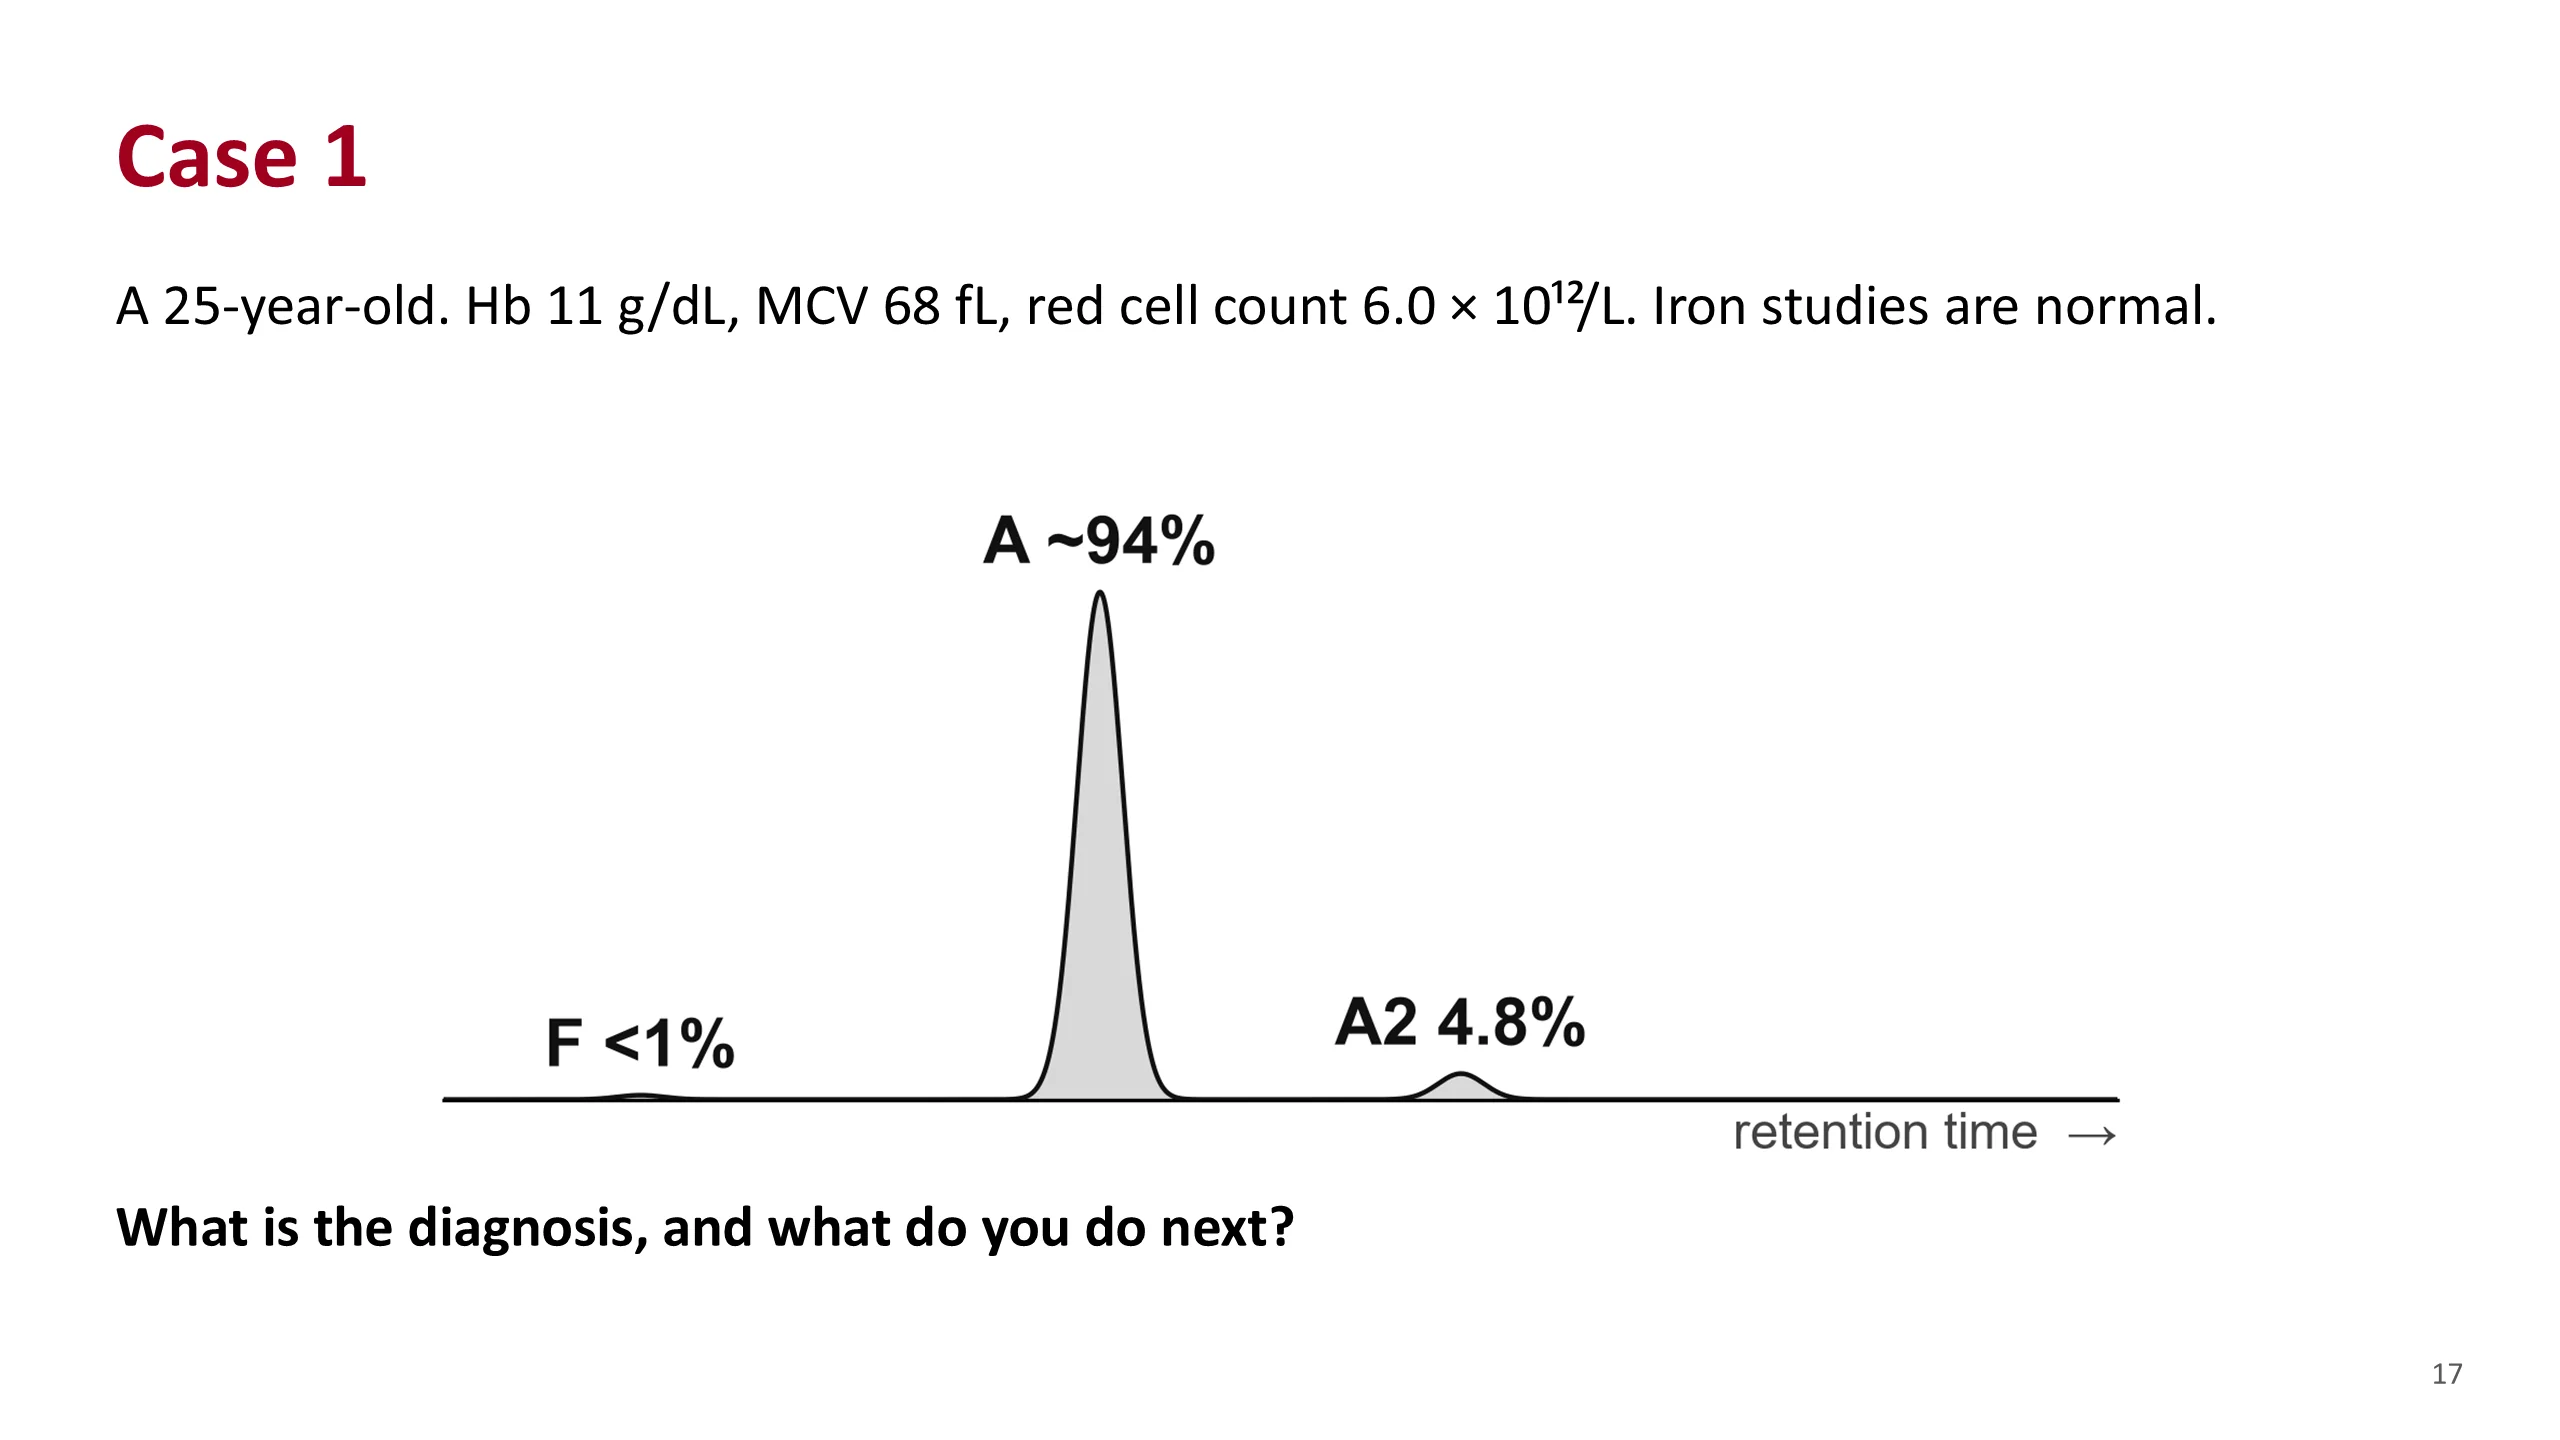
Case 1
Let the students work this one before you move on.
Walk through the routine. Adult, no transfusion. The blood count shows a mild anemia with very small cells and a high red cell count. That combination already points to thalassemia trait rather than iron deficiency. Iron studies are normal, so iron deficiency is not hiding anything.
Now the HPLC. HbA is present. There is no variant peak. HbA2 is 4.8%. HbF is not raised.
Ask them to commit to an answer before the next slide.
Source. Hematology Handbook, chapter 15, case vignette.
Case 1: answer
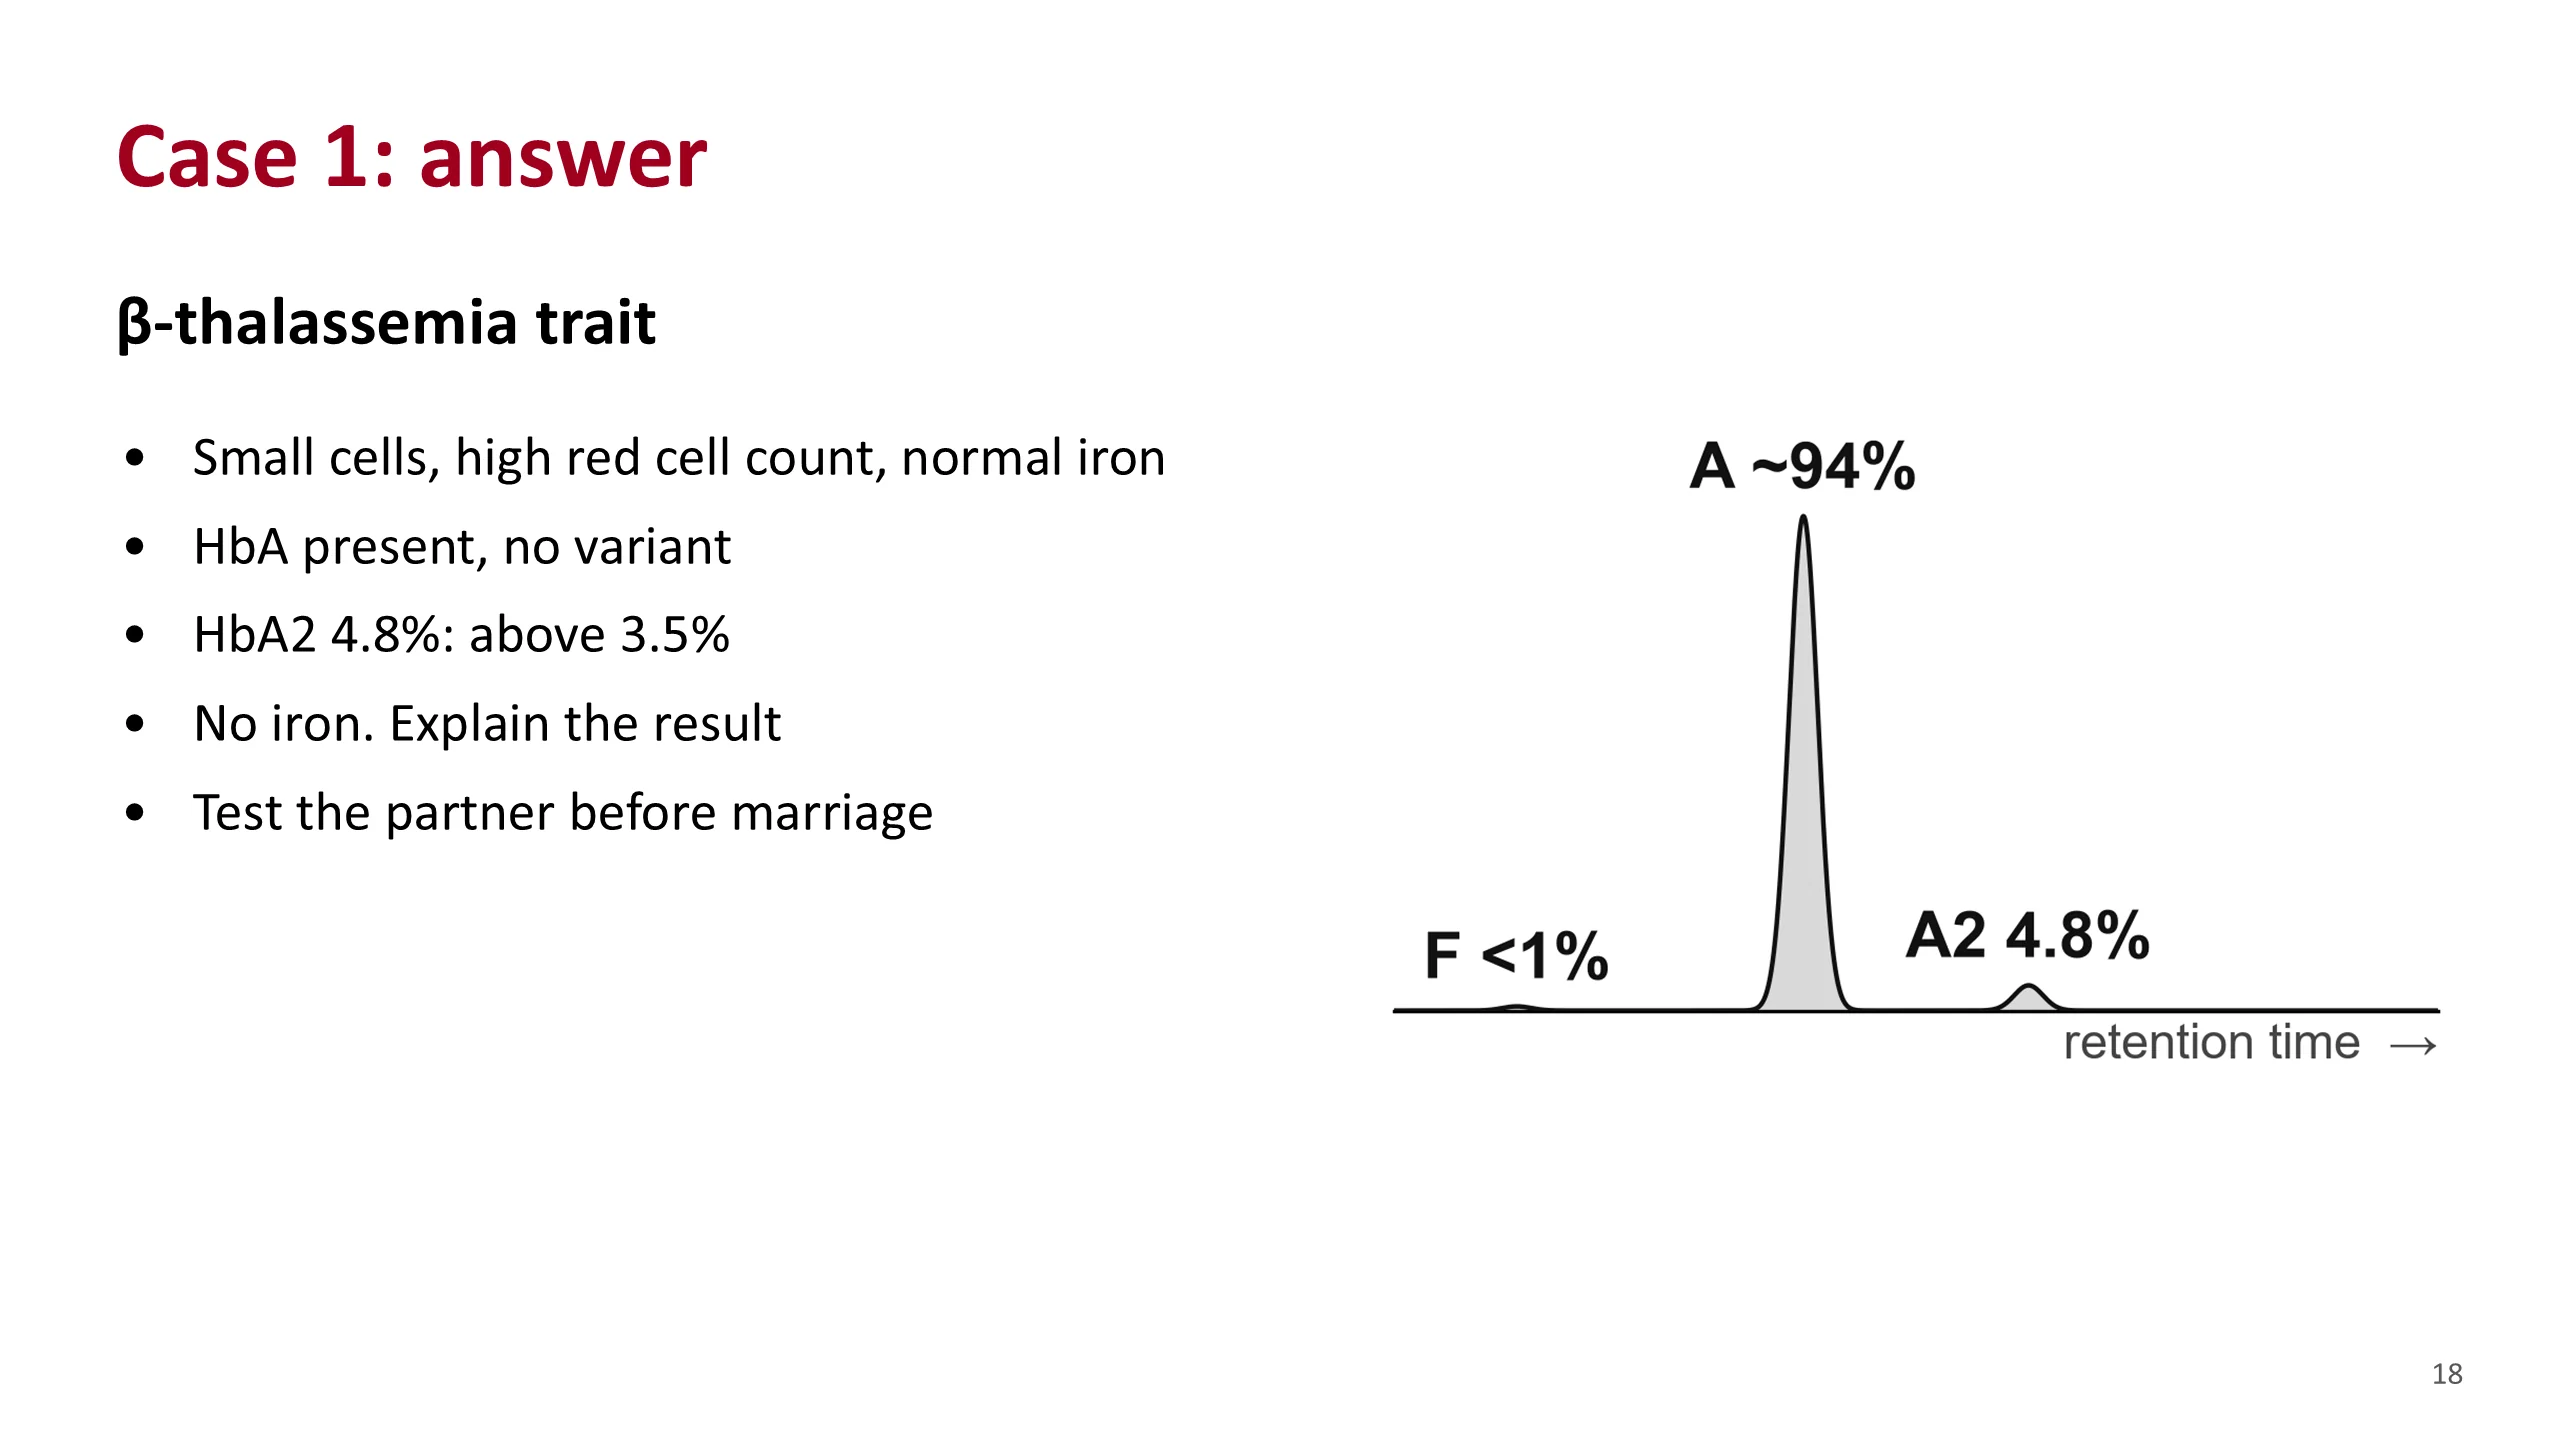
This is beta-thalassemia trait.
Mild anemia with marked microcytosis and a high red cell count, normal iron, and an HbA2 above 3.5%.
The action matters more than the label. Do not give iron. A patient like this is often treated for years as refractory iron deficiency, and iron can do harm. Explain what the result means. The real reason to make the diagnosis is the partner. If the partner is also a beta-thalassemia carrier, each pregnancy has a one in four chance of thalassemia major. If the partner carries HbS, each pregnancy has a one in four chance of sickle-beta-thalassemia.
Source. Hematology Handbook, chapters 6 and 15.
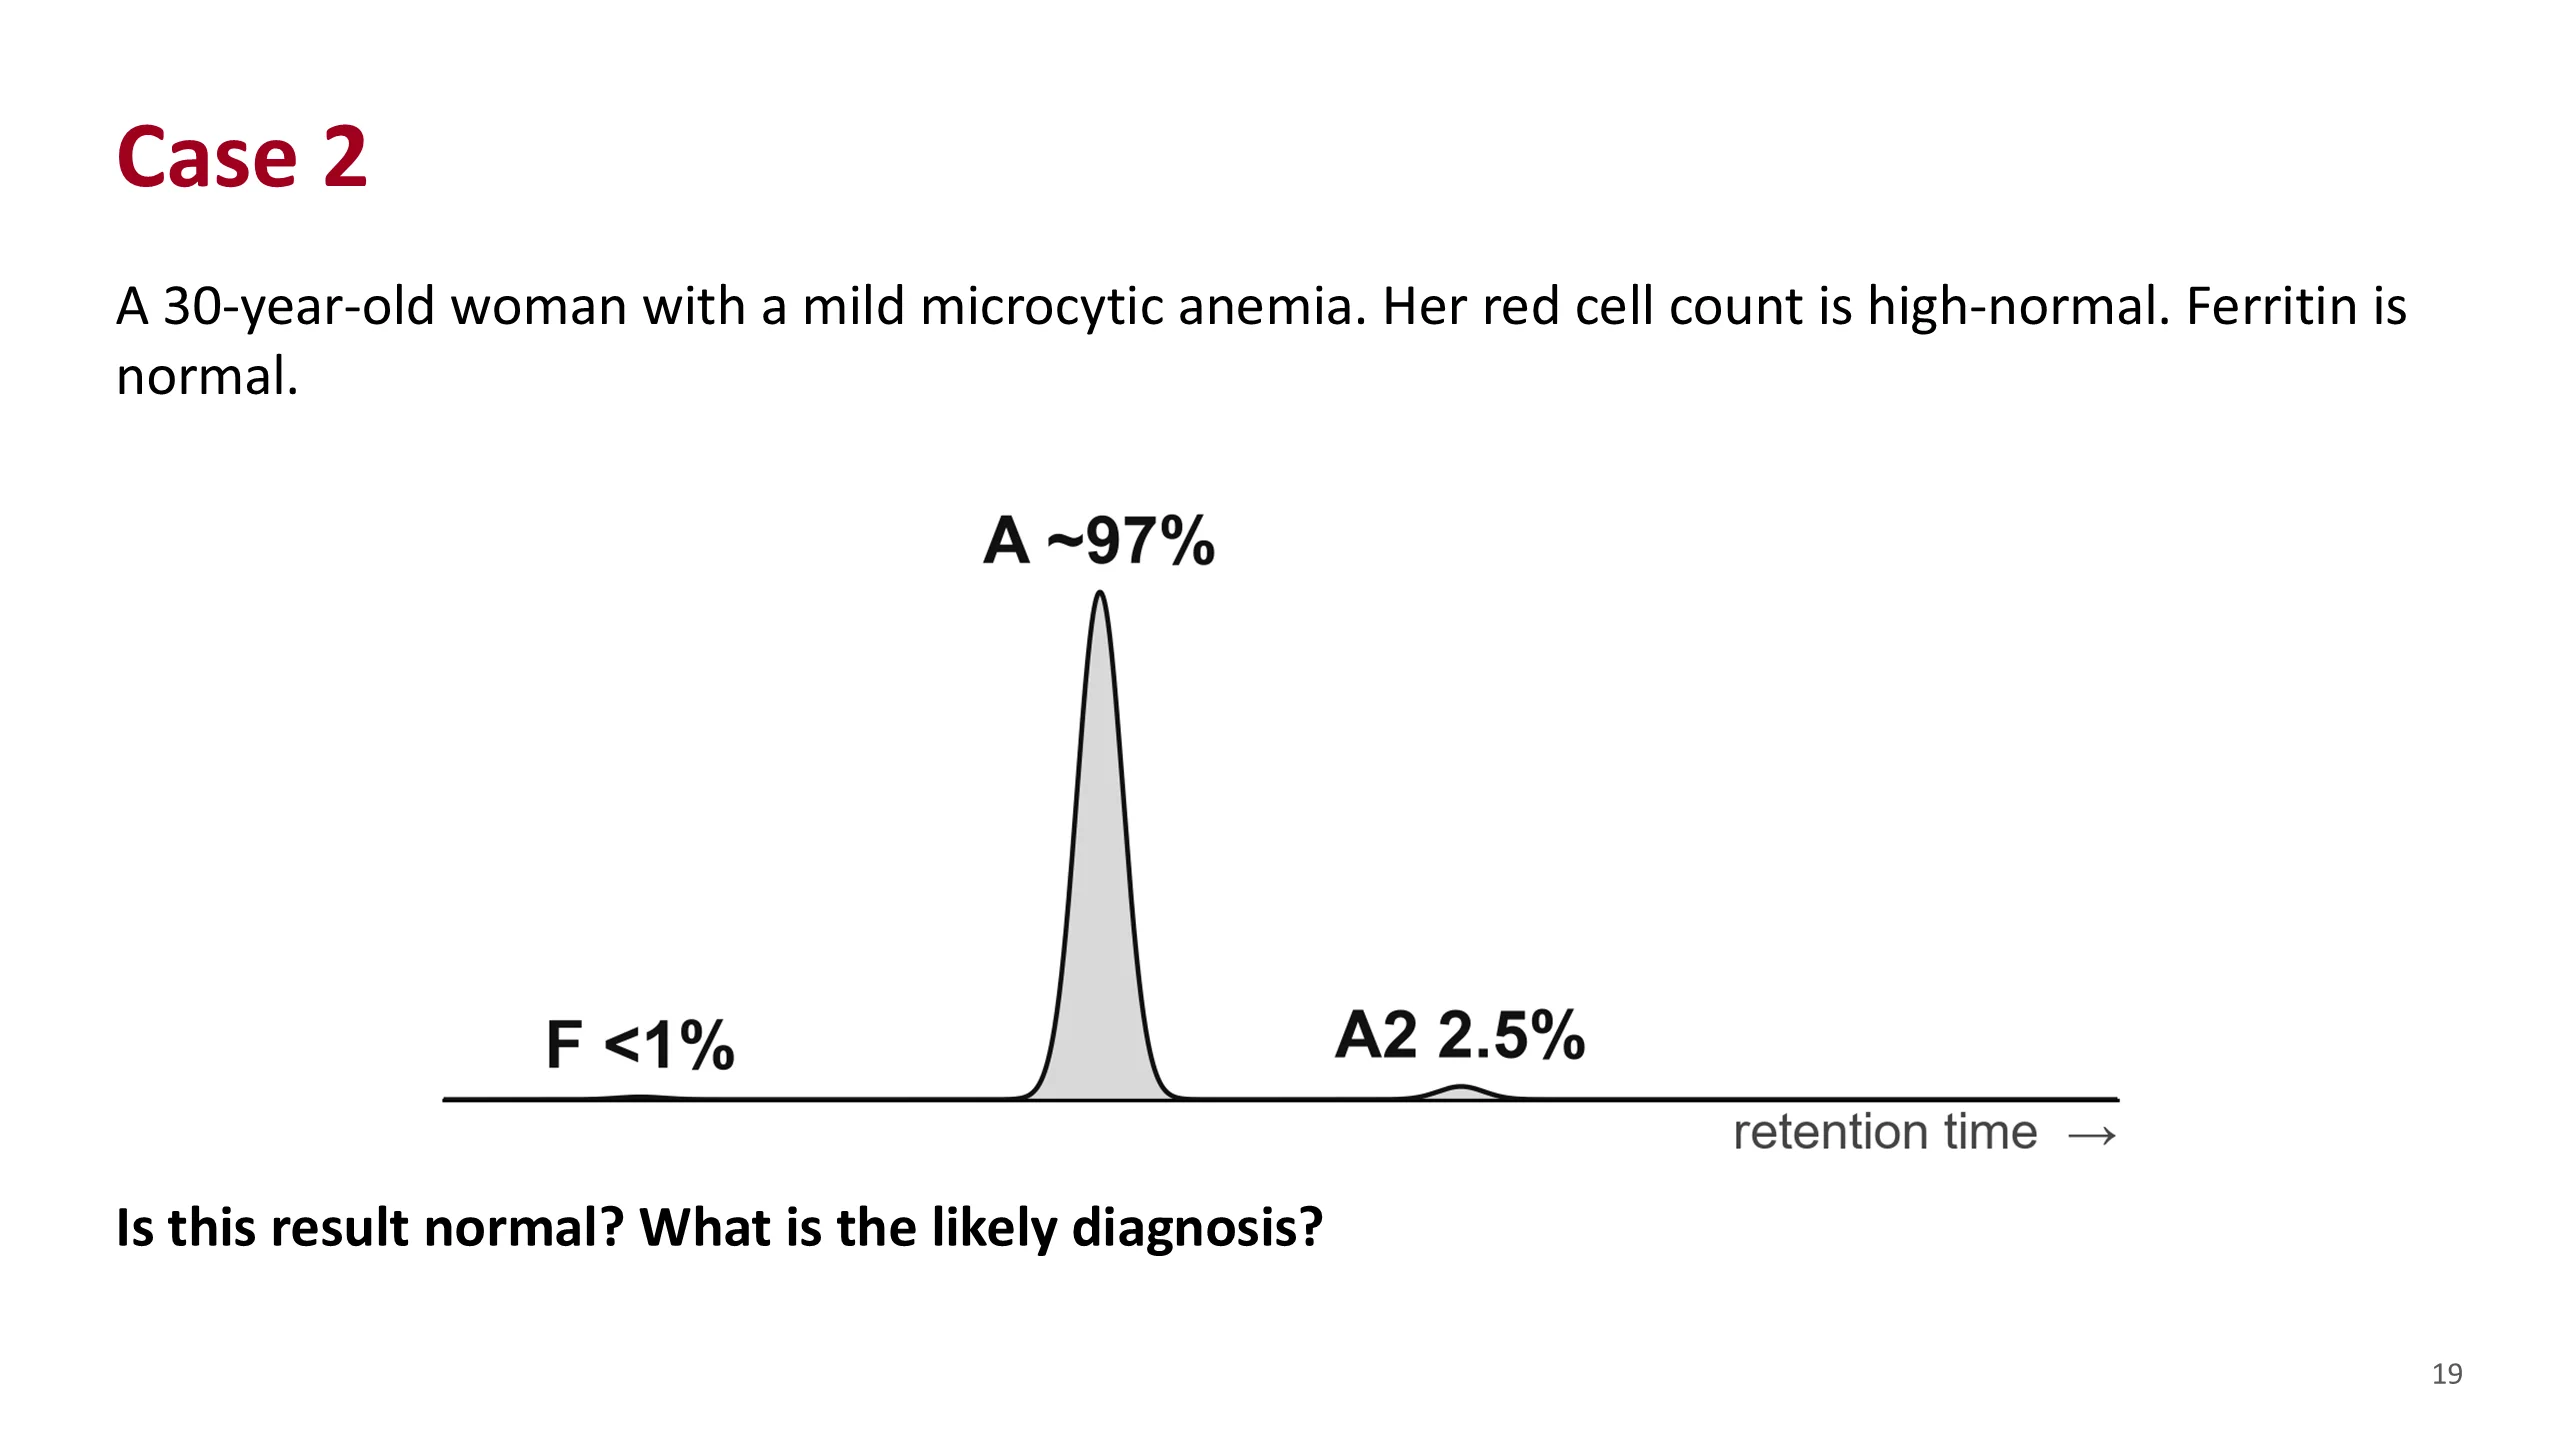
Case 2
The HPLC looks normal. HbA about 97%, HbA2 2.5%, HbF below 1%.
But the patient is not normal. She has small cells with normal iron. Ask the students what explains small cells when iron is normal and the electrophoresis is normal.
Give them time. The answer is the one diagnosis the test cannot see.
Case 2: answer
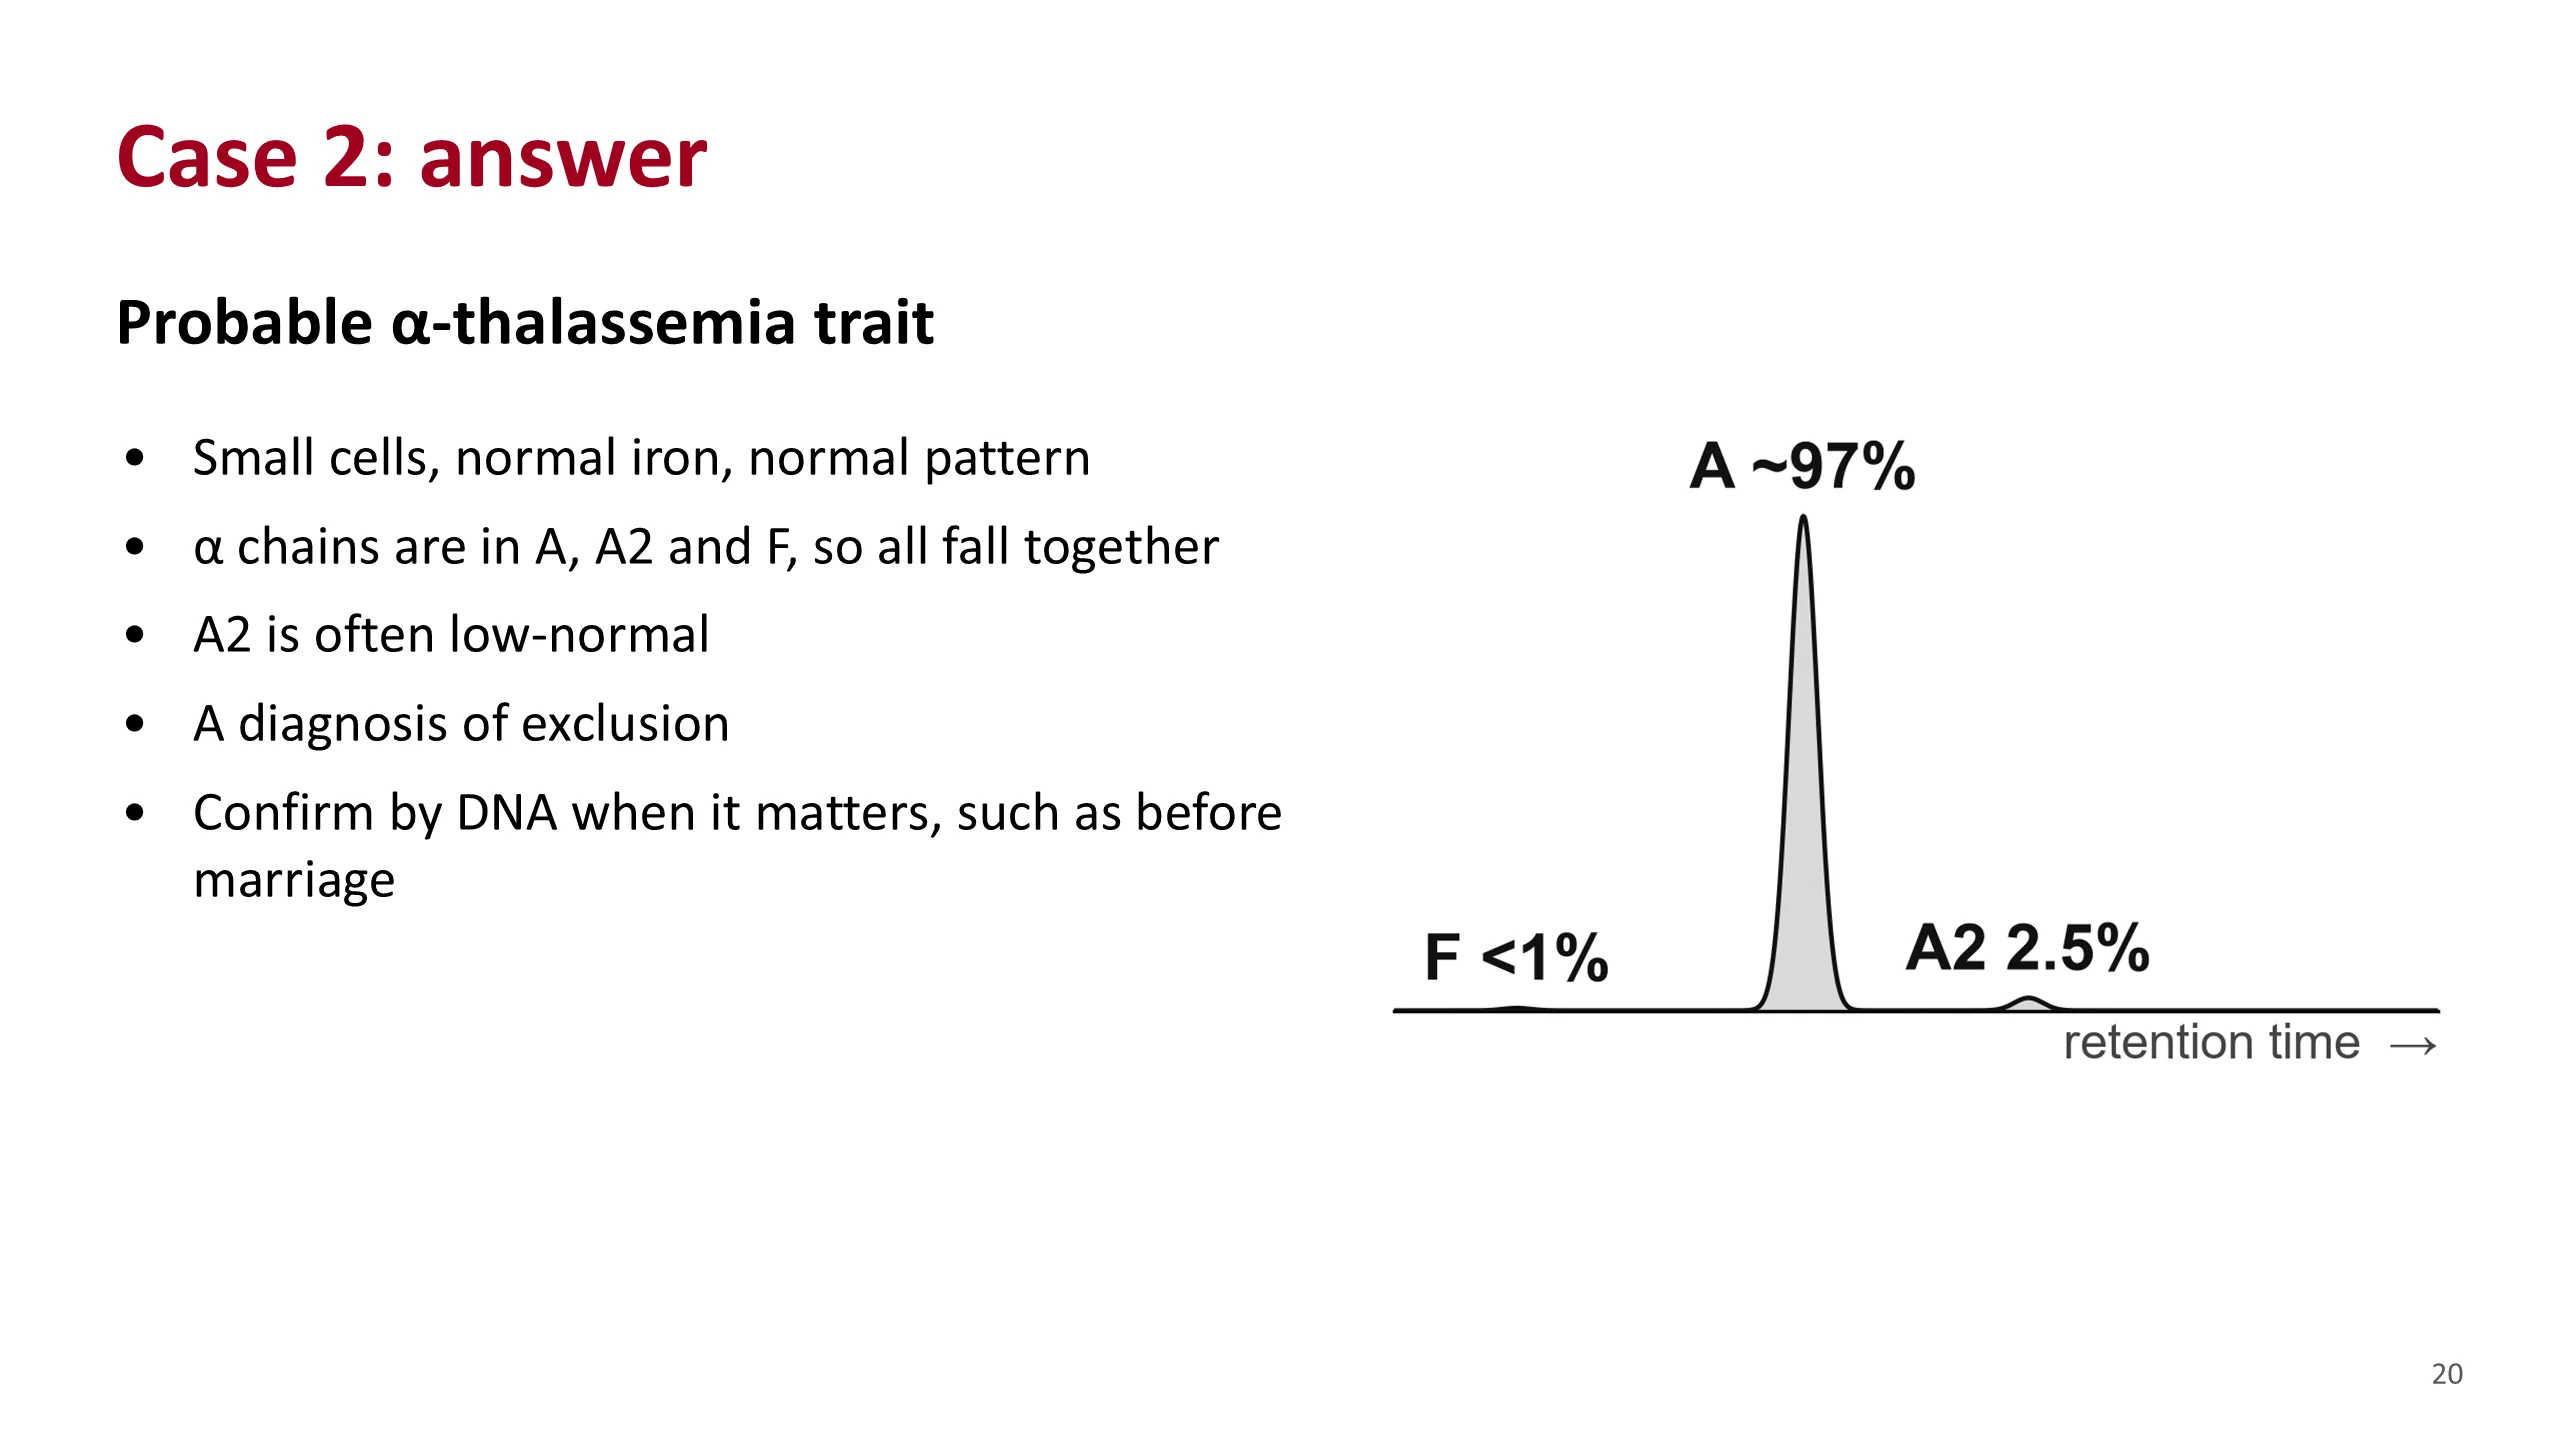
The likely diagnosis is alpha-thalassemia trait.
The test cannot see it. All three hemoglobins need alpha chains, so a shortage of alpha chain lowers all three together. The proportions do not change, and no new peak appears. If anything, A2 is low-normal.
So the diagnosis is made by exclusion. Small cells, normal iron, normal electrophoresis. Make sure iron deficiency really has been excluded first, because iron deficiency also lowers A2 and could be hiding a beta-thalassemia trait.
When it matters, as it does before marriage, DNA testing confirms it.
This is also the one case in this lecture where a normal report is not reassuring.
Sources. Hematology Handbook, chapter 6. Anemia Part 3, slides 13 and 15.
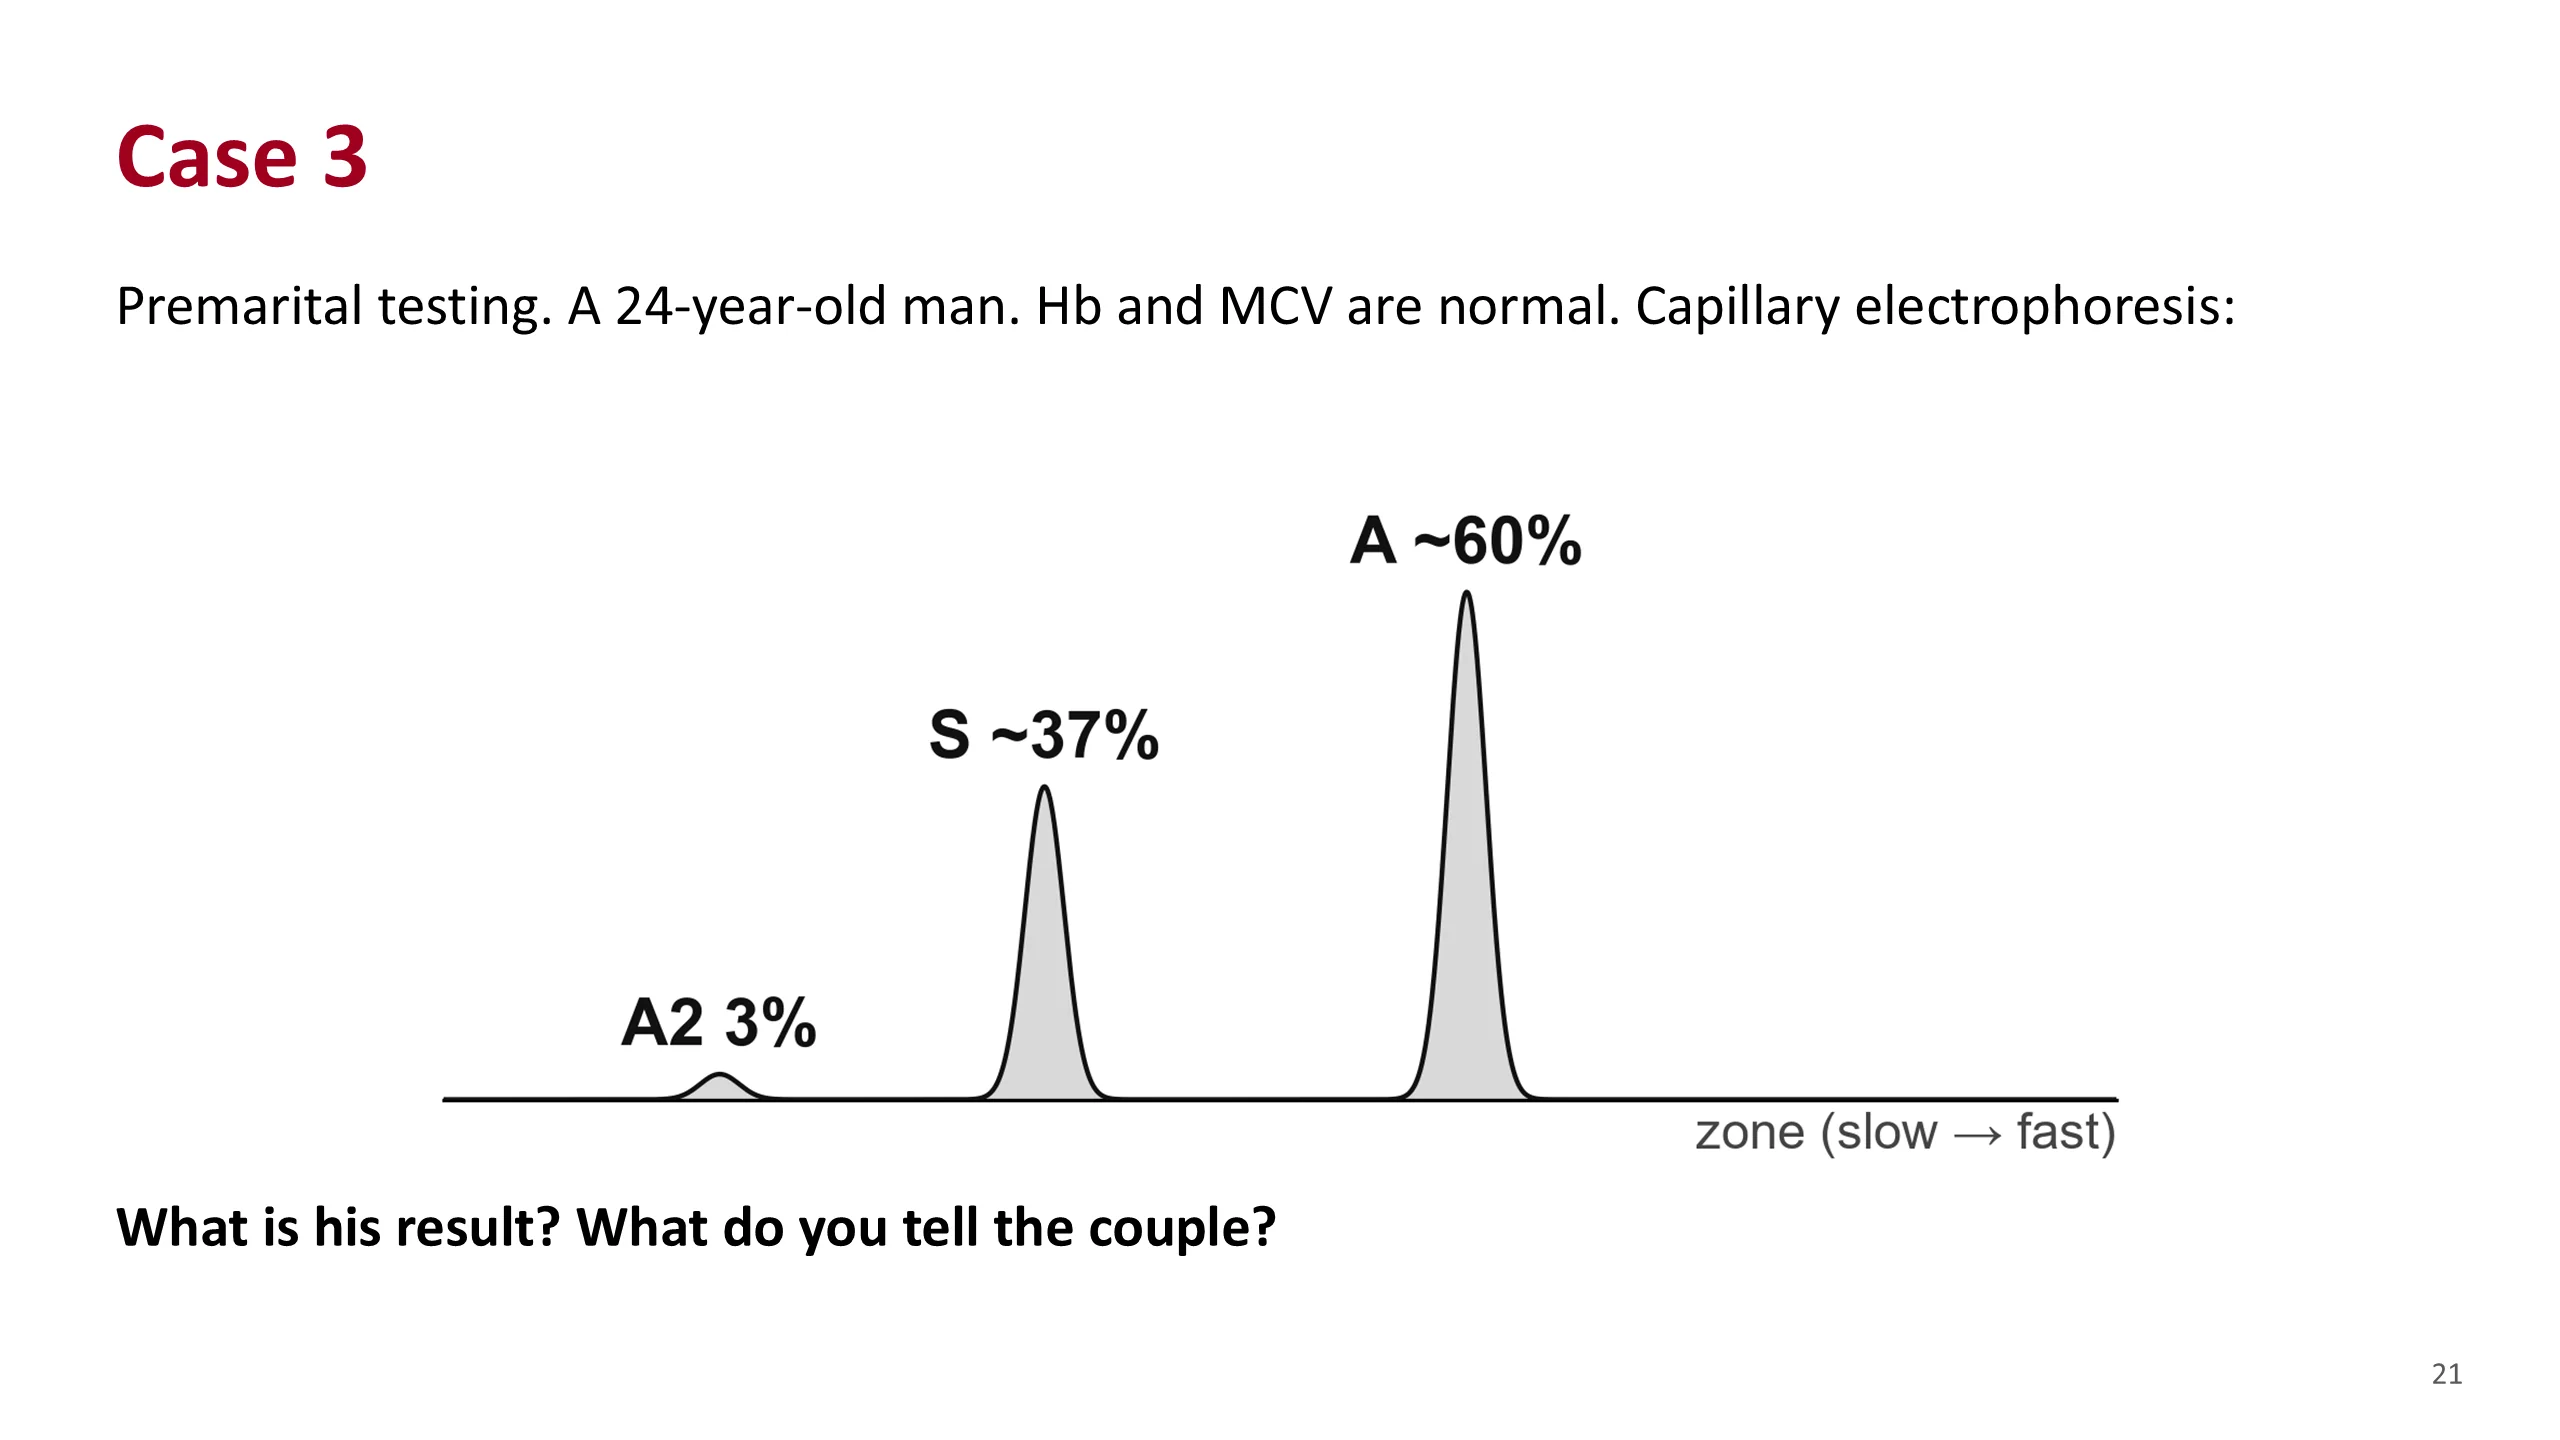
Case 3
A premarital result. The man is well and his blood count is normal.
There are two main peaks. HbA about 60%, HbS about 37%, and a normal A2.
Ask: is HbA there? Yes. Is there a variant? Yes, in the S zone. Which is larger? HbA.
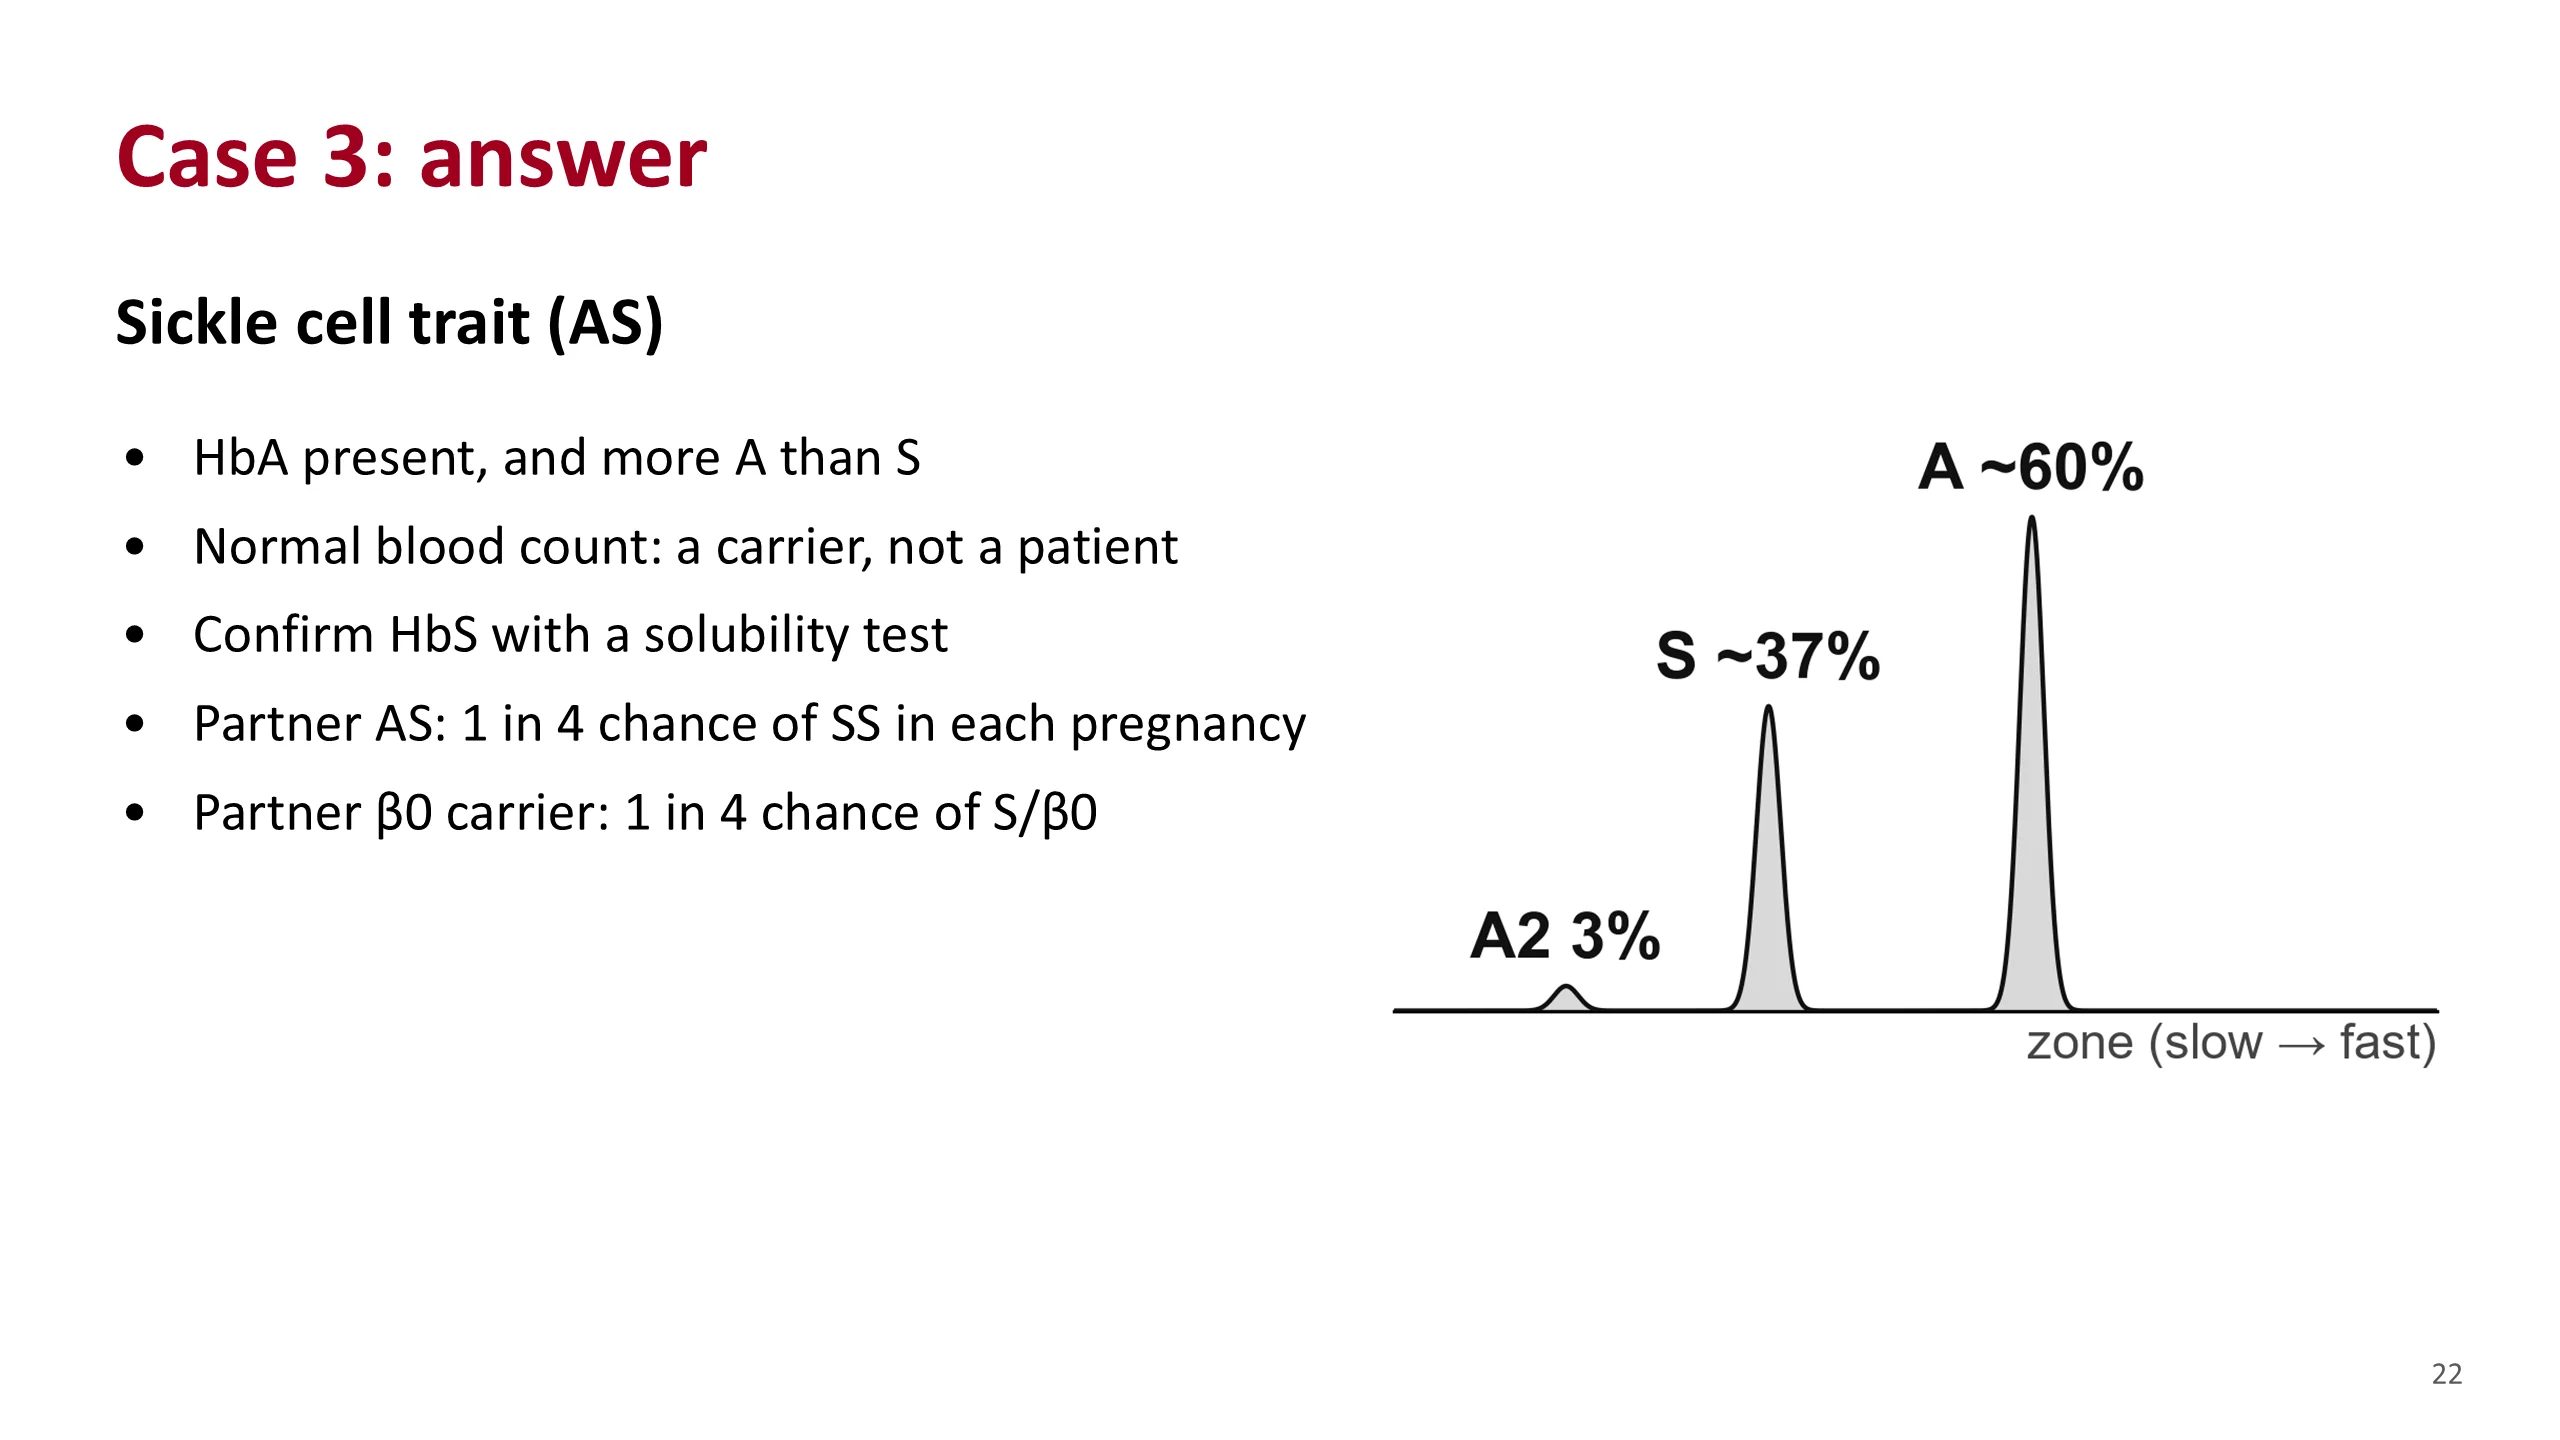
Case 3: answer
This is sickle cell trait.
HbA is present and there is more A than S. The blood count is normal. He is a carrier, not a patient. The S peak should be confirmed as HbS by a sickle solubility test.
What matters is the partner. If she also has sickle trait, each pregnancy has a one in four chance of SS. If she is a beta-zero thalassemia carrier, each pregnancy has a one in four chance of sickle-beta-zero thalassemia, which behaves like SS. That is why both partners are tested.
If his HbS had been lower than usual, think of coexisting alpha-thalassemia trait.
Sources. Hematology Handbook, chapter 6. Bain, Haemoglobinopathy Diagnosis, 3rd edition, 2020, chapter 2, for the solubility test.
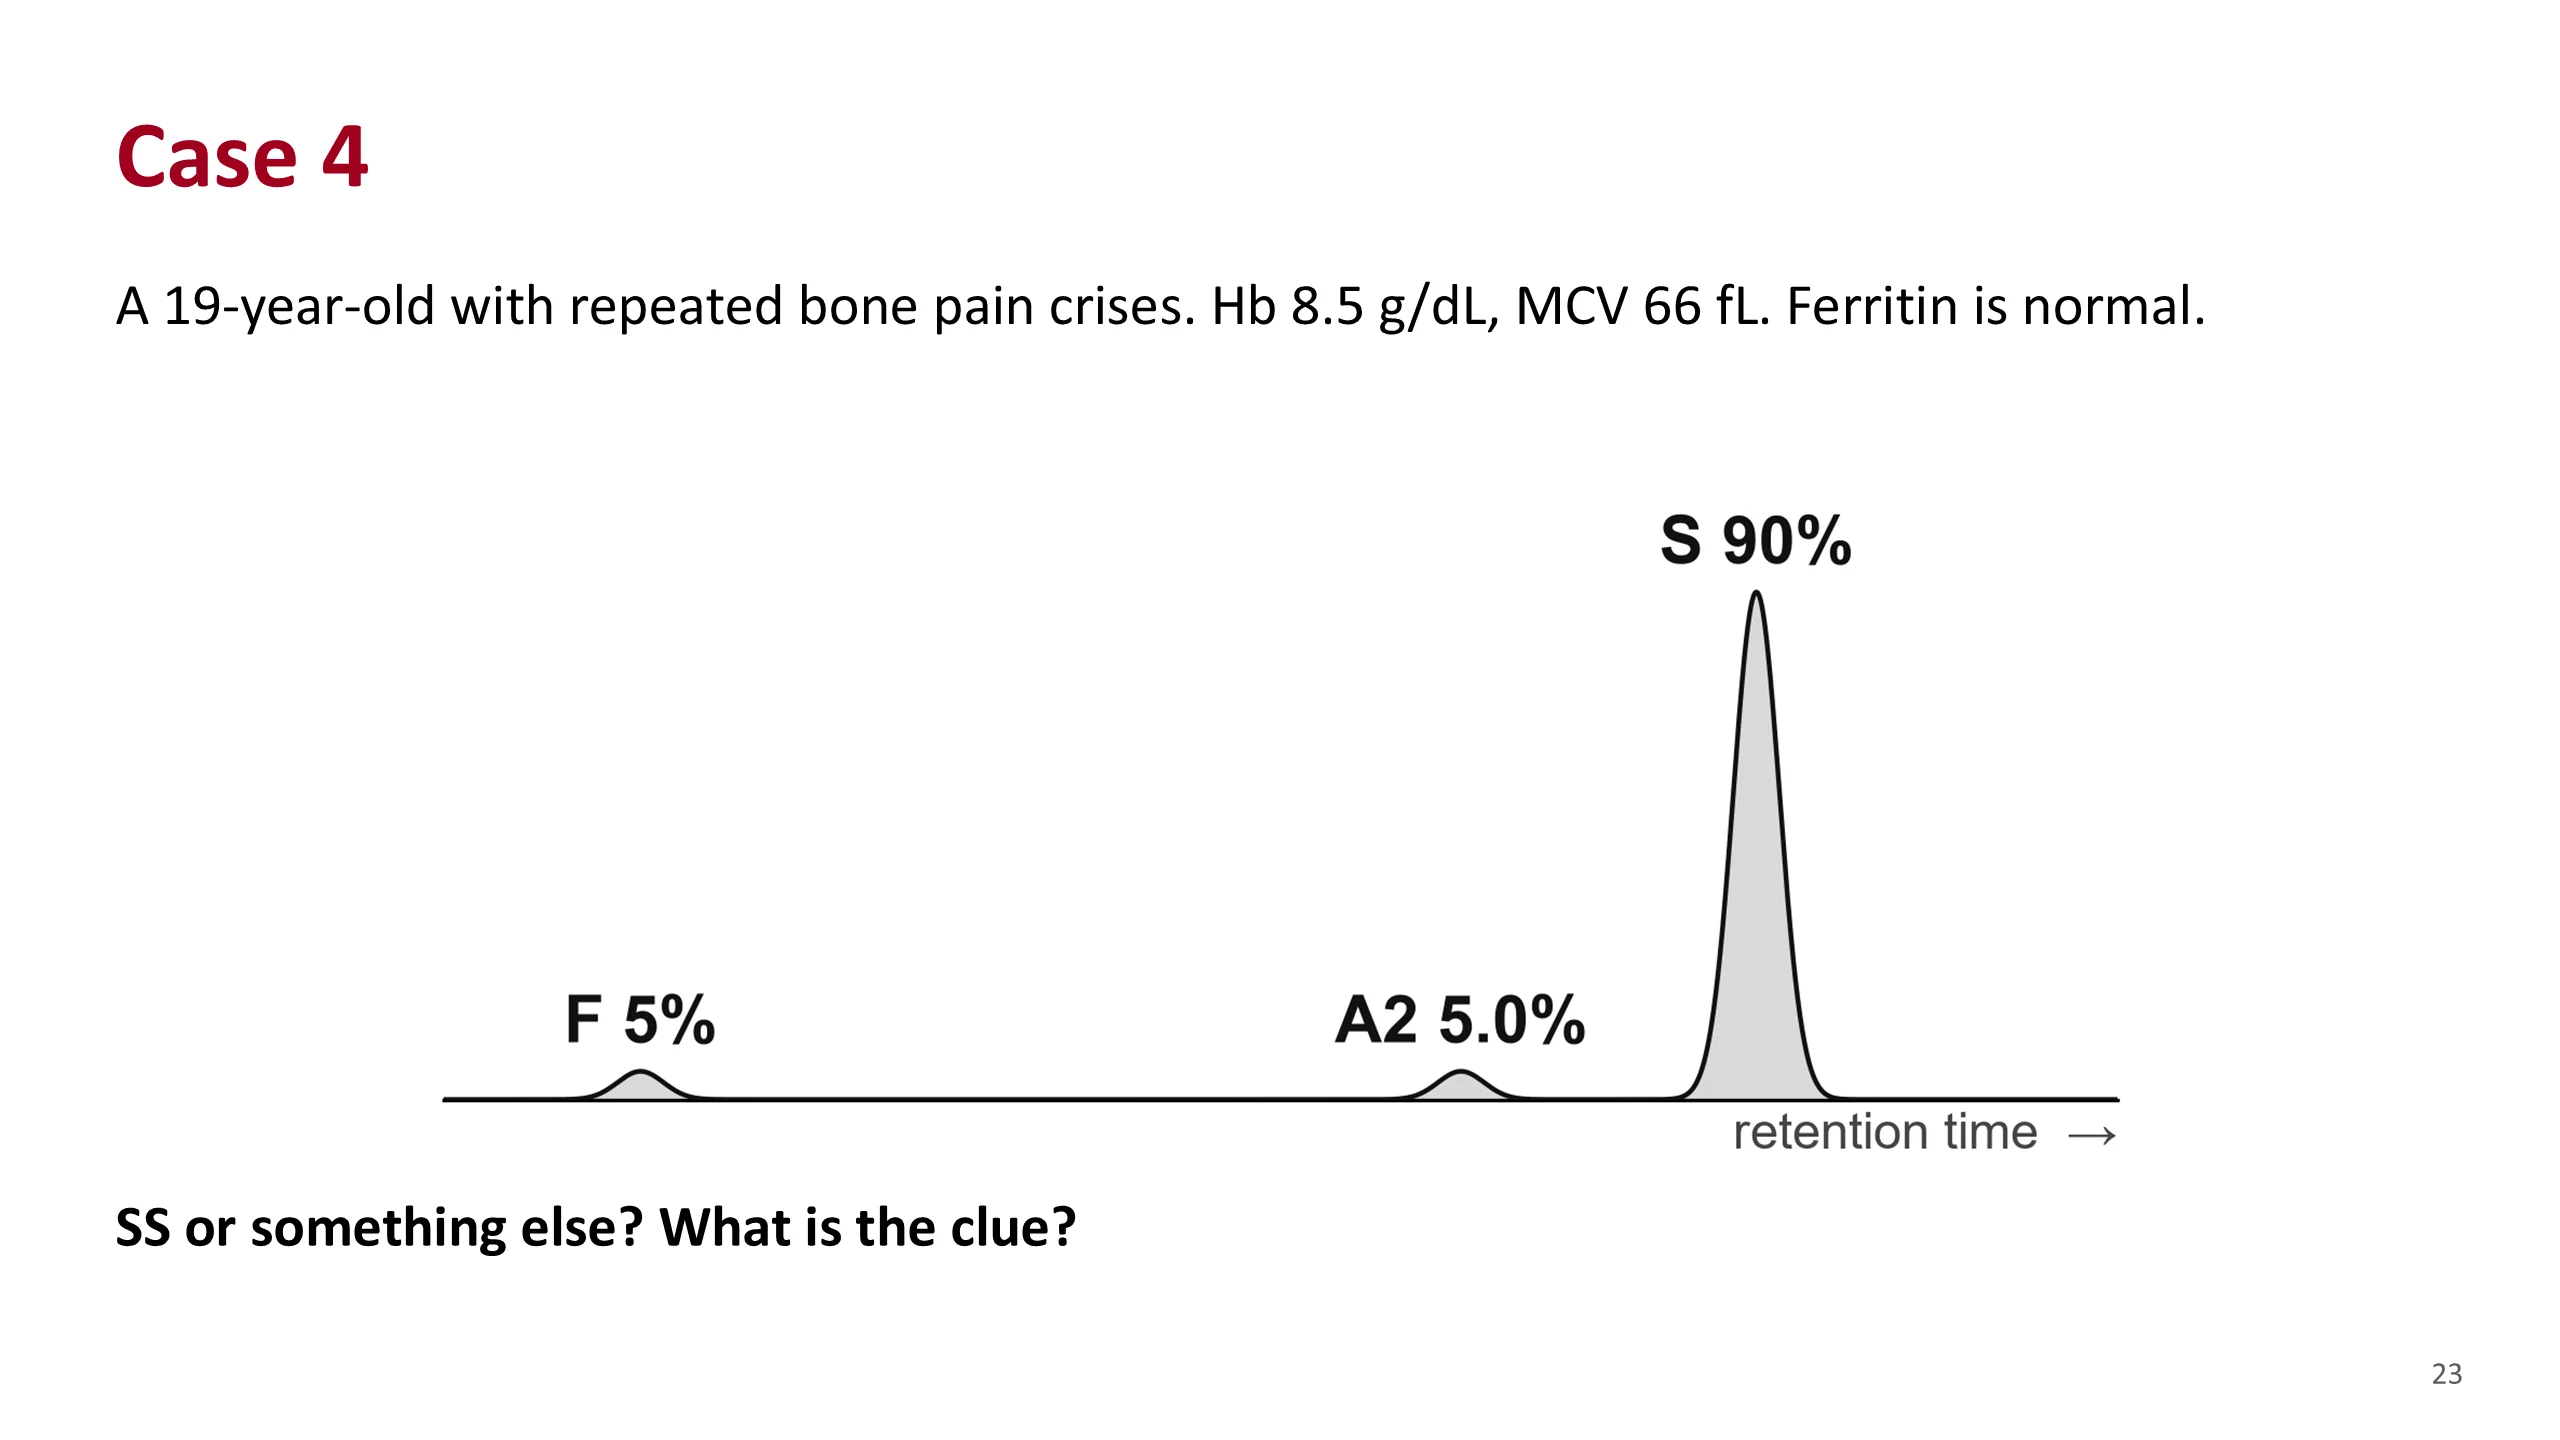
Case 4
A young man with sickle cell crises. He has a moderate anemia, but notice the MCV: 66 fL, with normal iron.
The HPLC shows no HbA, HbS 90%, A2 5.0% and F 5%.
Ask: is HbA there? No. So this is sickle cell disease, not trait. But is it SS? What about the MCV?
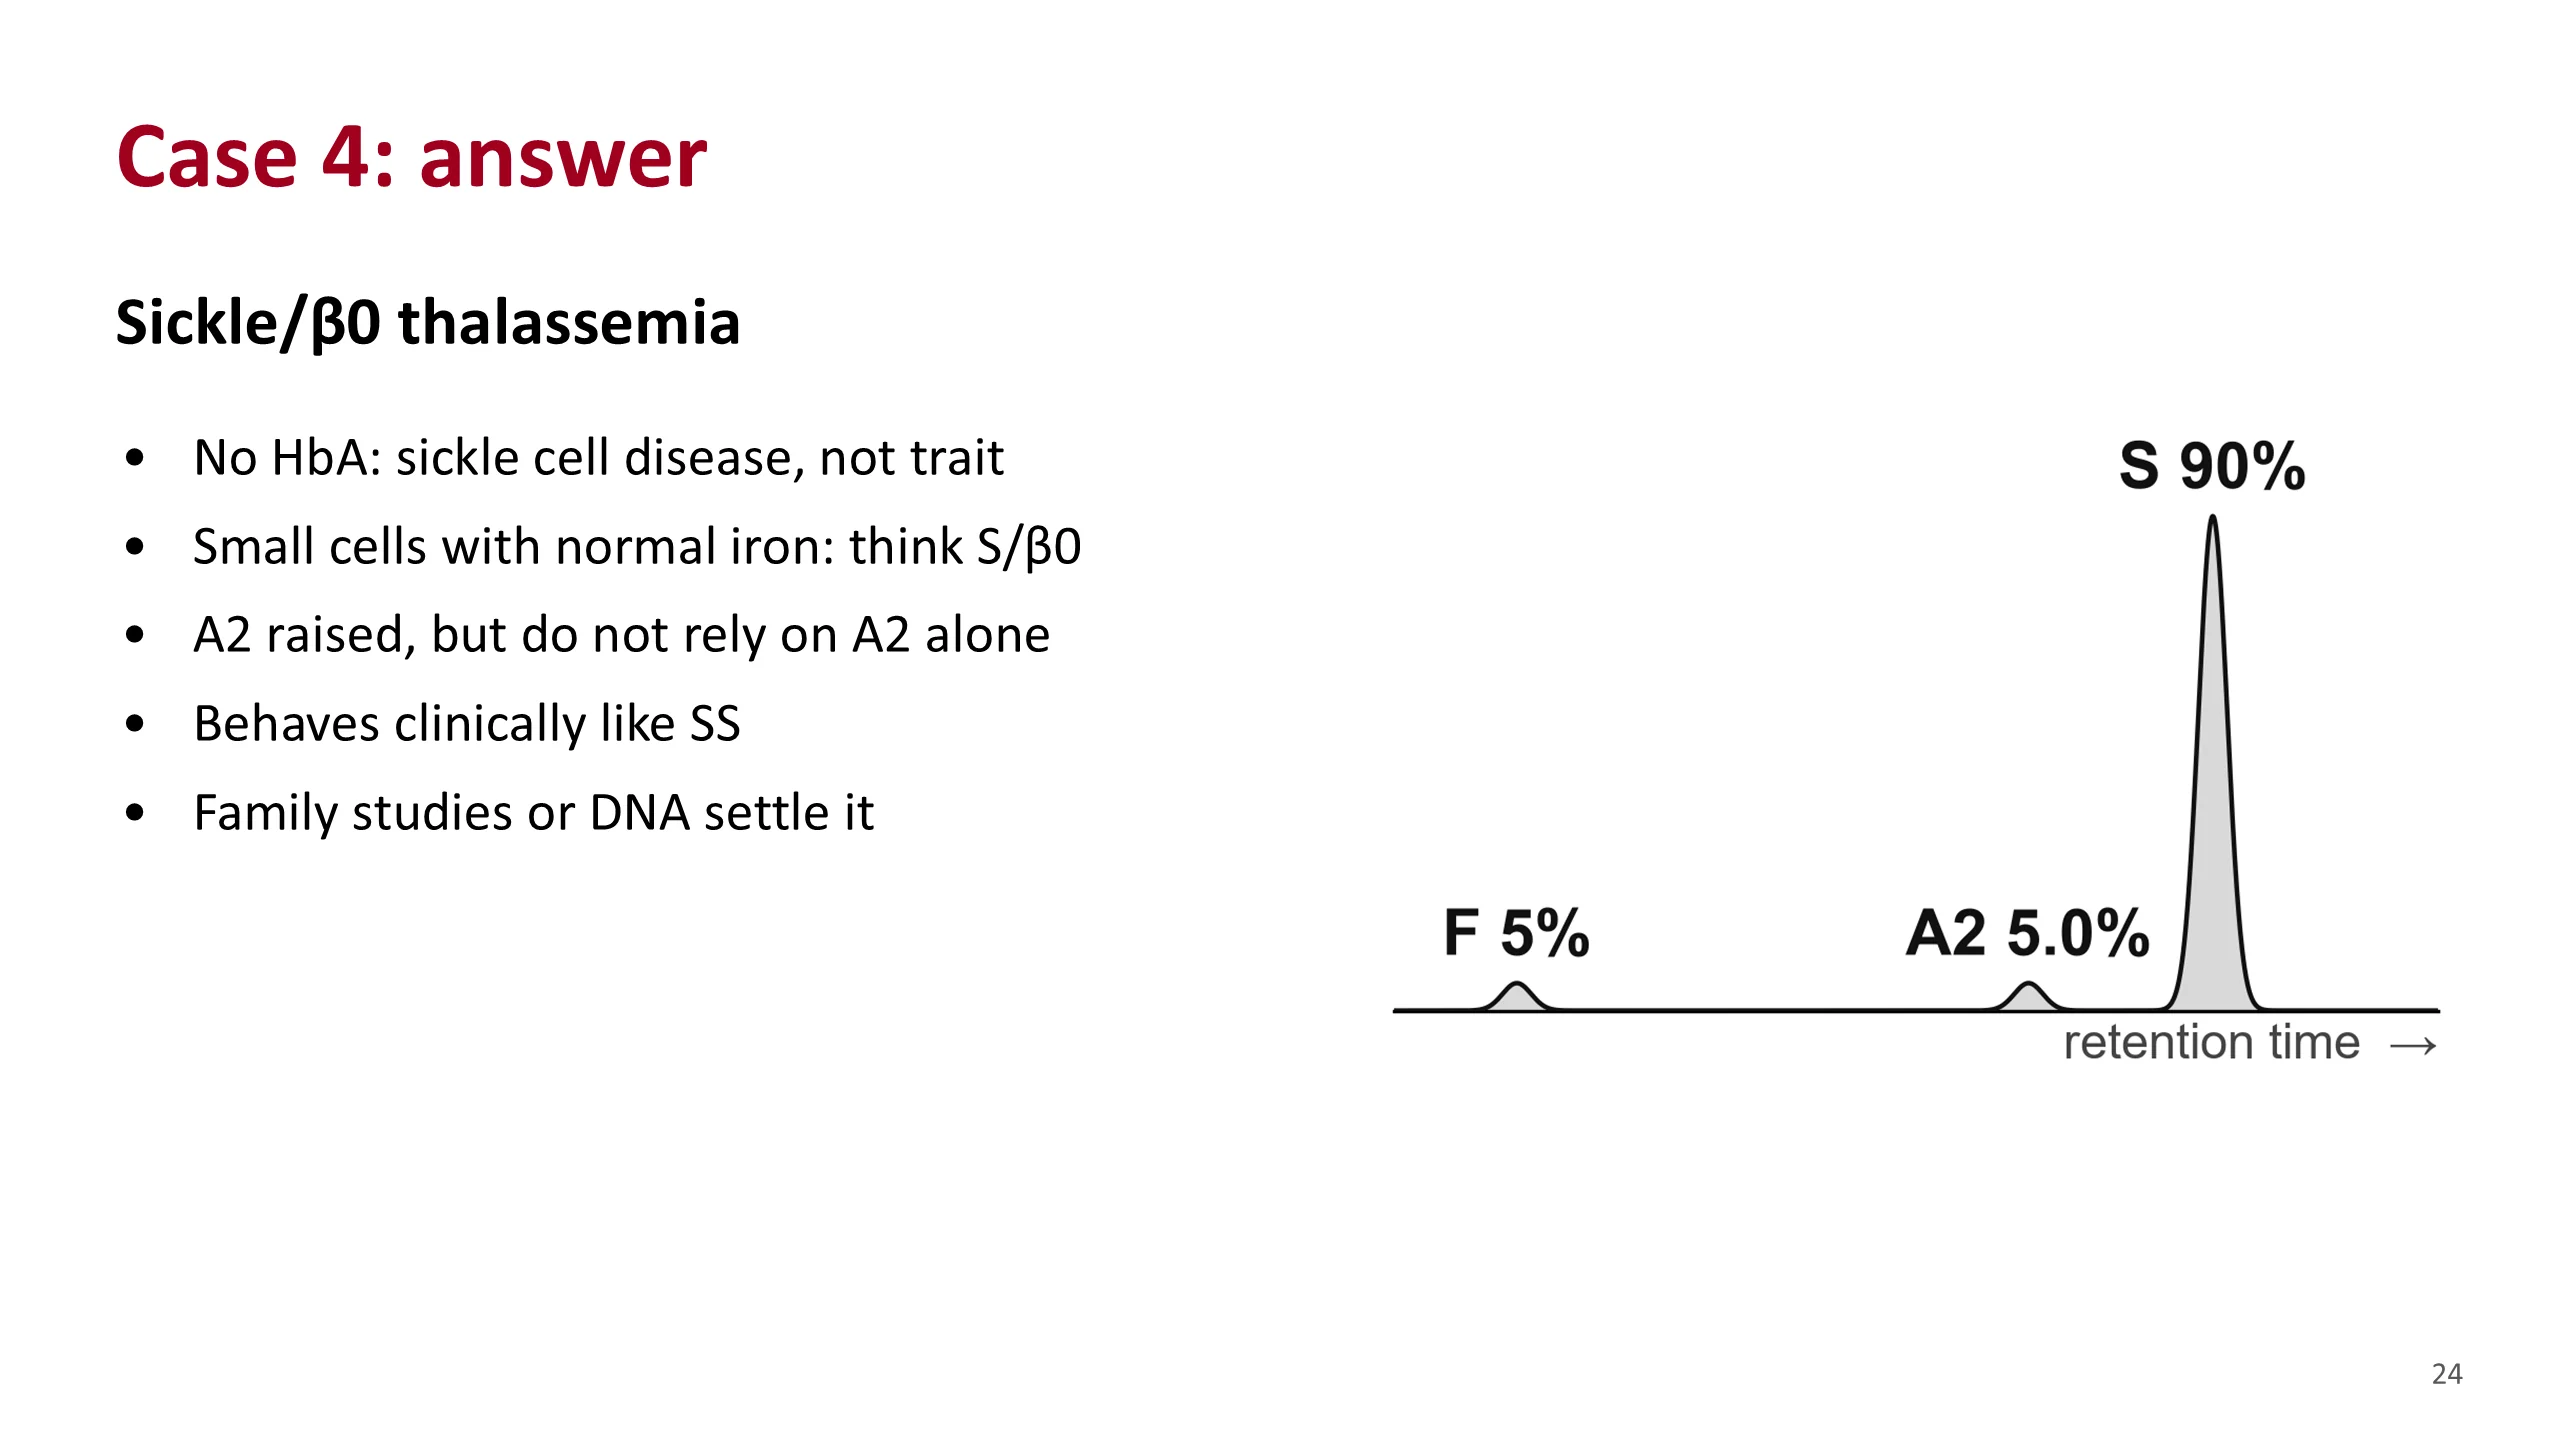
Case 4: answer
The most likely answer is sickle-beta-zero thalassemia.
There is no HbA, so this is sickle cell disease. On the electrophoresis alone it could be SS. The clue is the small cells with normal iron. SS does not usually give small cells unless alpha-thalassemia is also present.
The A2 of 5% supports it, but do not rest the diagnosis on A2. In SS, A2 can run a little above 3.5%, and HPLC reads A2 high in the presence of HbS. Bain gives a usual A2 of 4 to 5.6% in sickle-beta-zero but an overlap with SS.
Clinically it behaves like SS, so his care does not change. The diagnosis matters for his family: one parent should be a sickle carrier and the other a beta-thalassemia carrier. Testing the parents or DNA analysis settles it.
Sources. Hematology Handbook, chapter 6. Bain, Haemoglobinopathy Diagnosis, 3rd edition, 2020, chapter 4, table 4.8.
Case 5
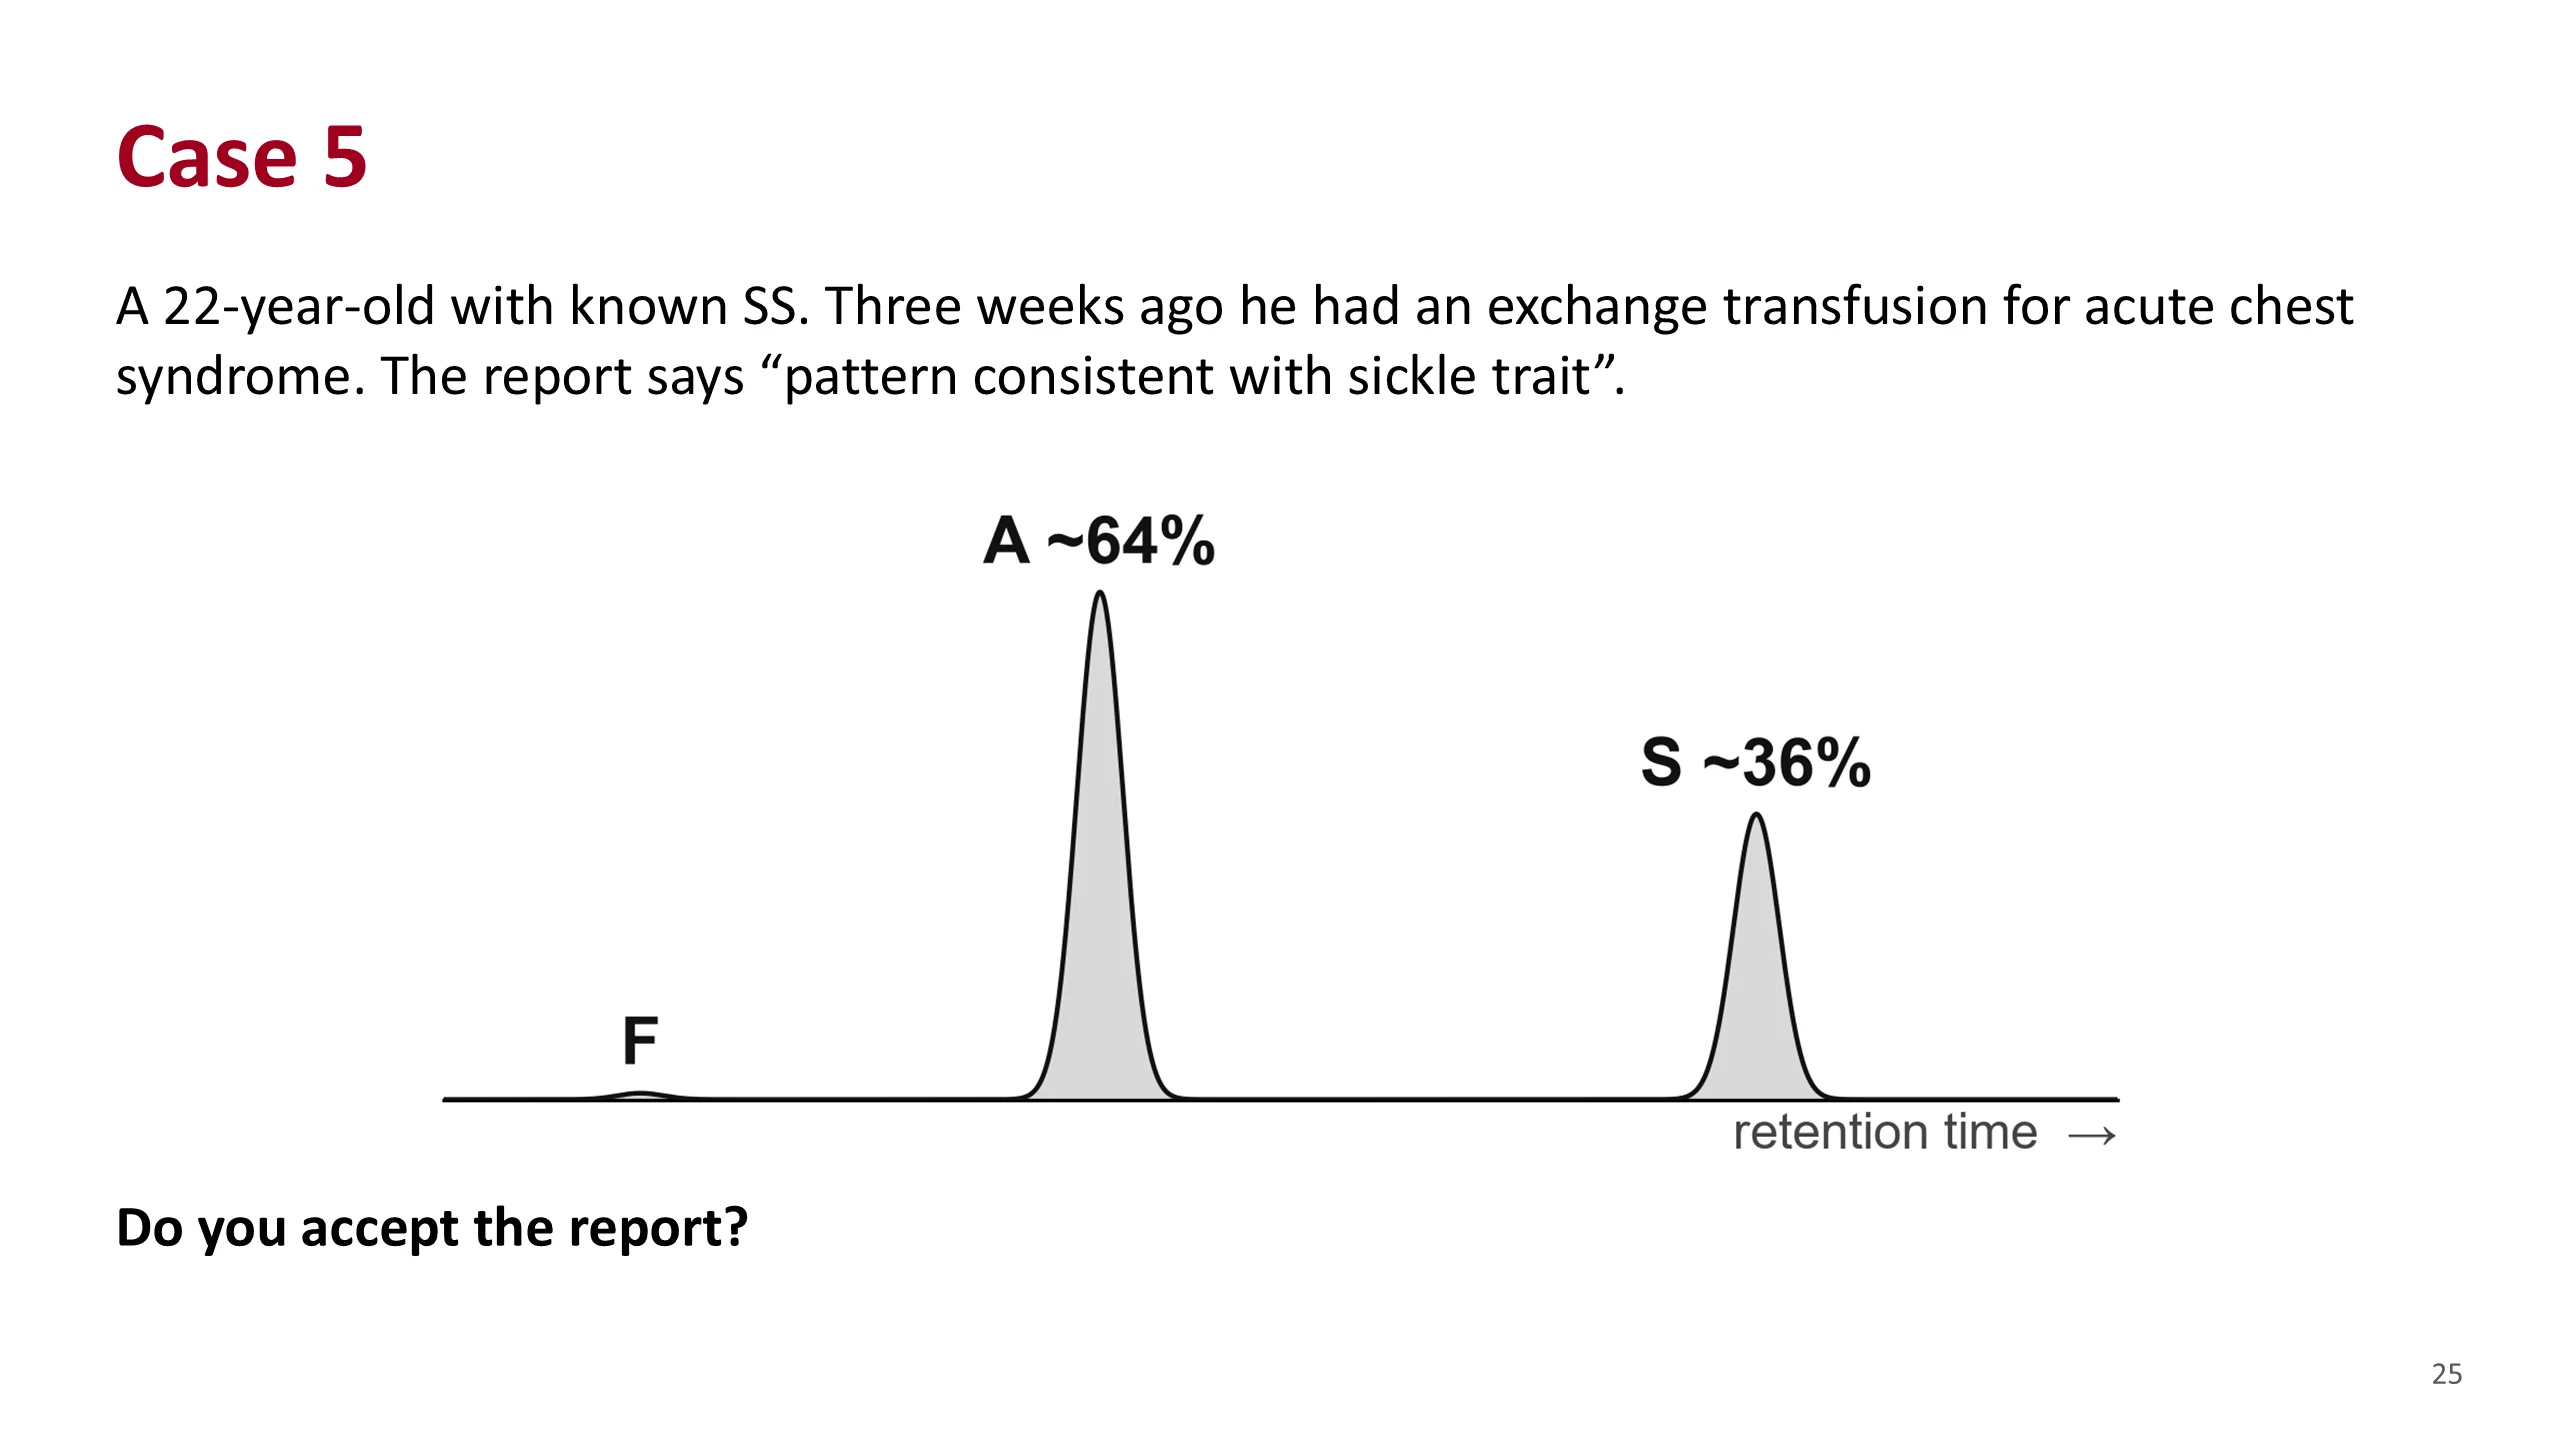
A known SS patient. He had an exchange transfusion three weeks ago. The laboratory, given no history, reports the result as sickle trait.
HbA about 64%, HbS about 36%.
Ask the class: does he have sickle trait now?
Case 5: answer
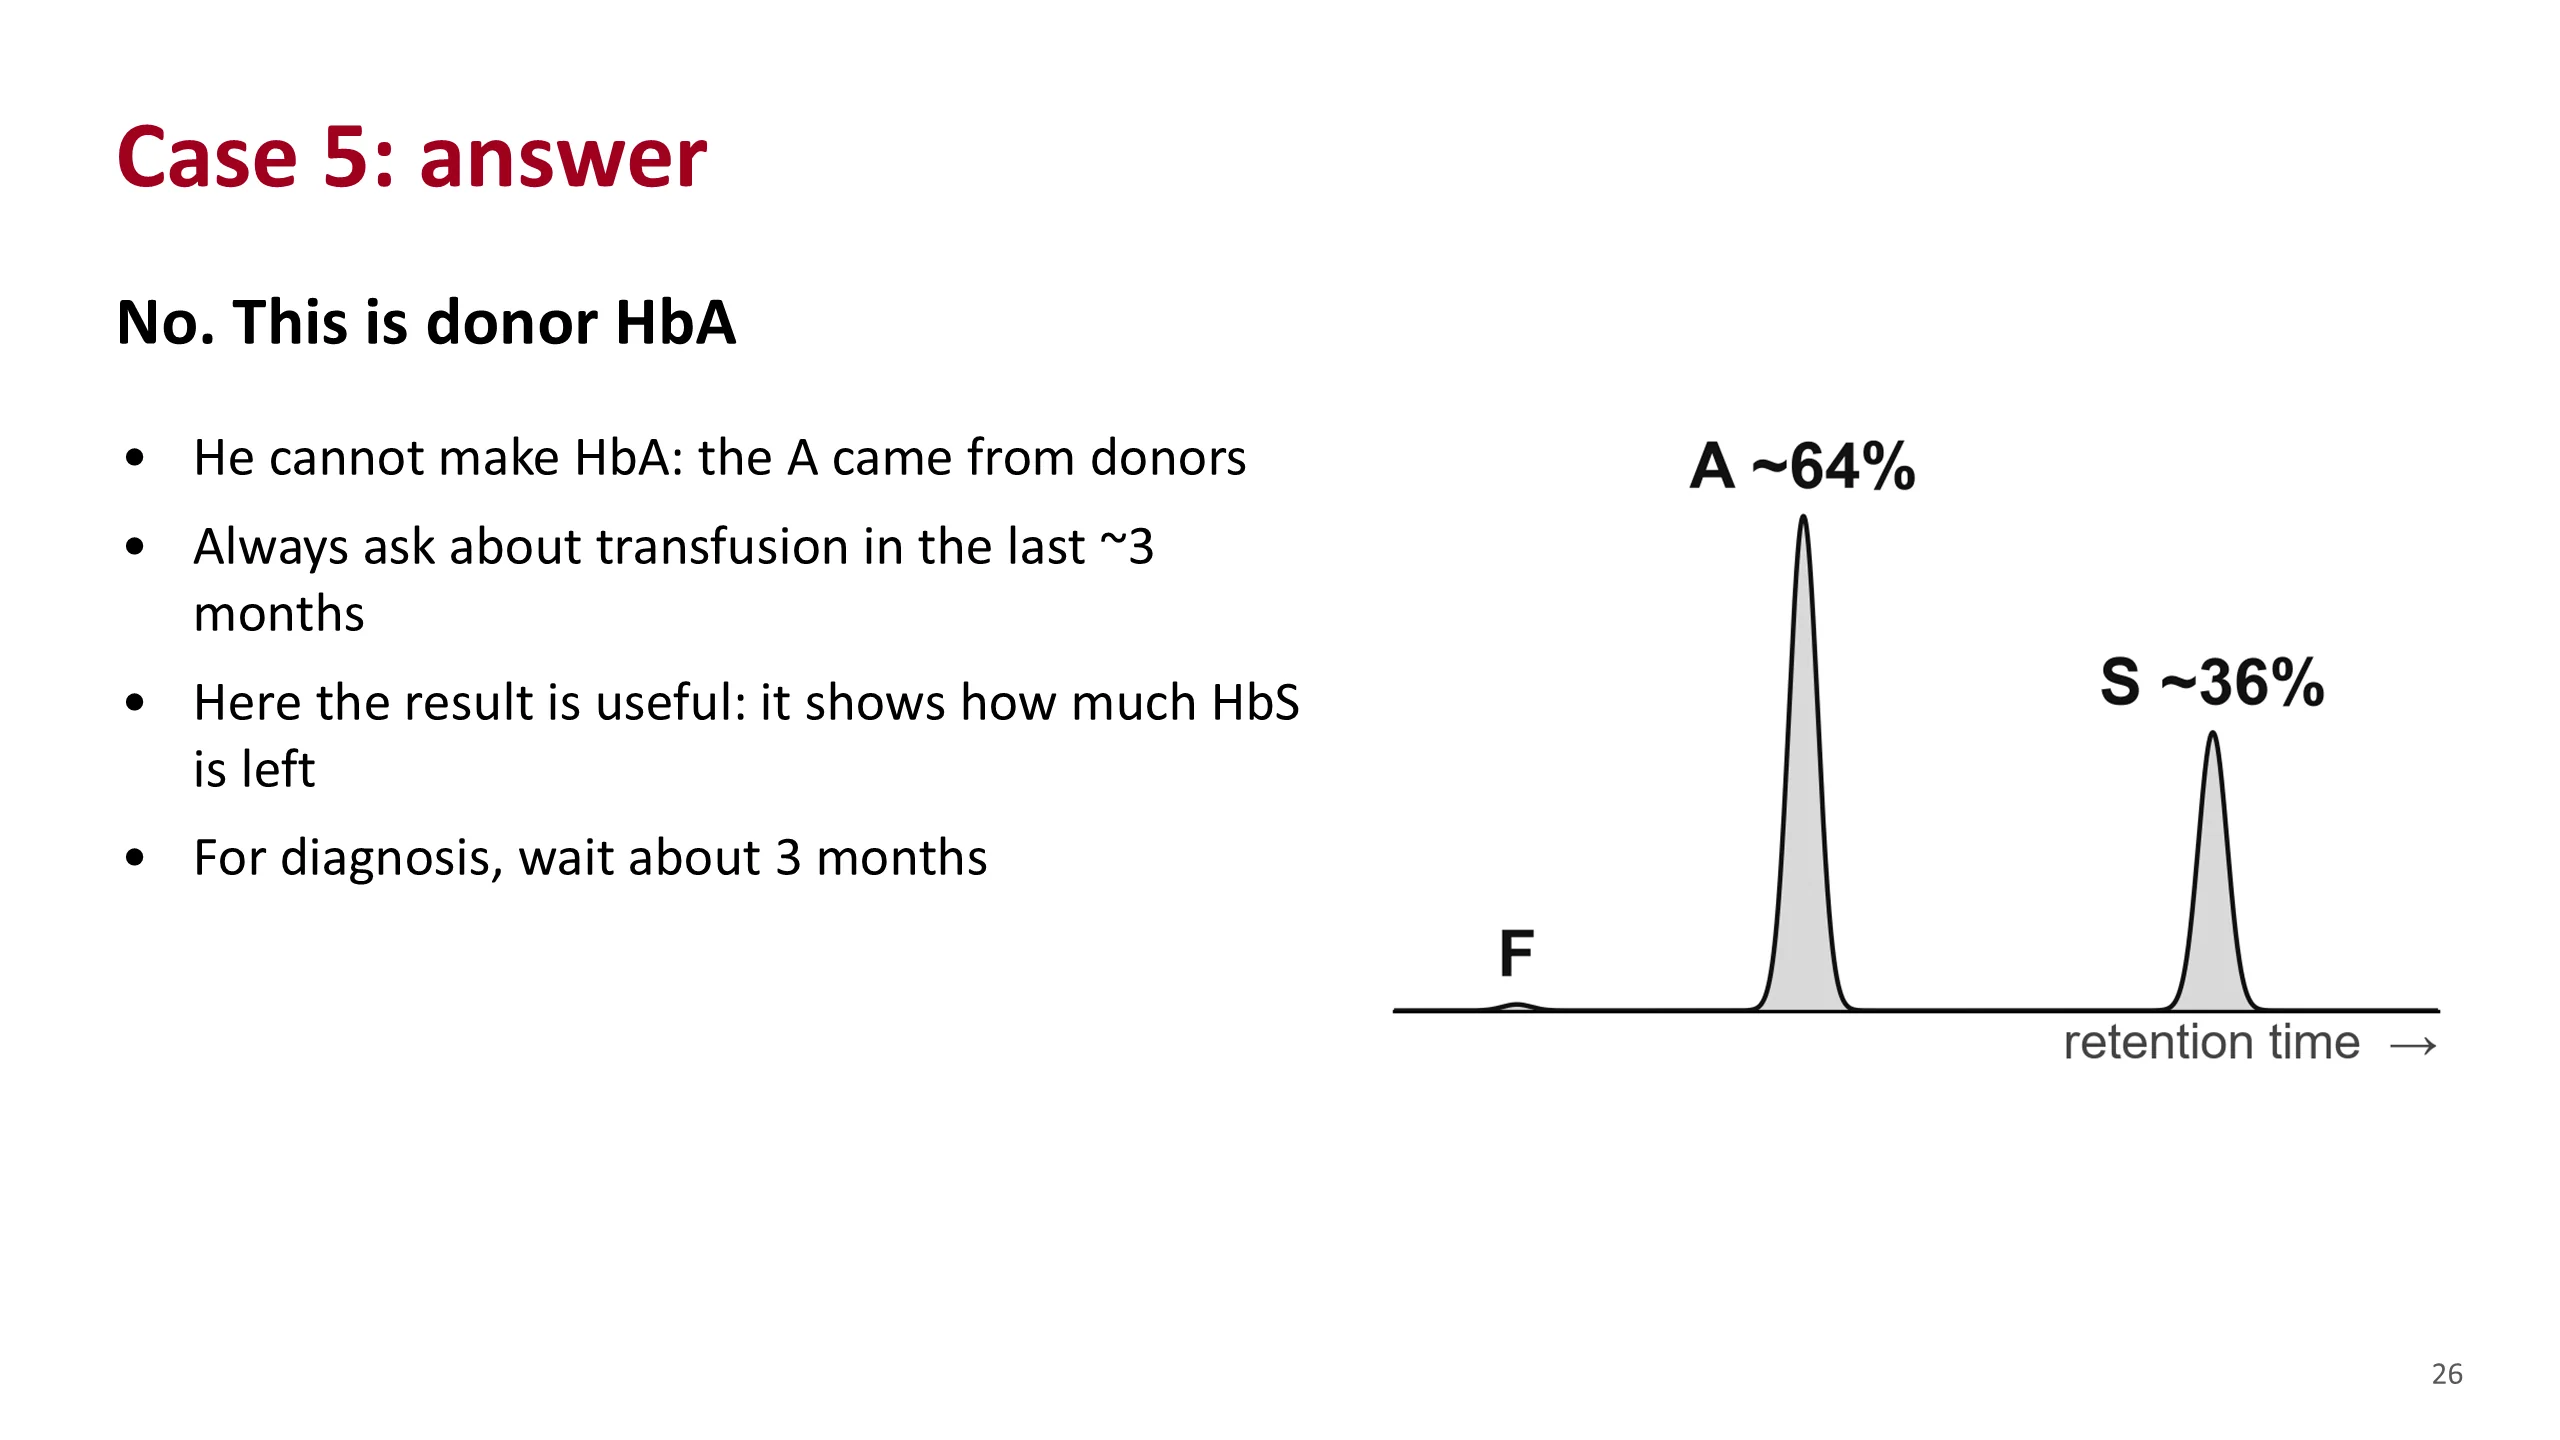
No. He has SS and cannot make HbA. Every bit of HbA on this report came from donor blood.
This is the transfusion pitfall. The lab had no history, so it read the pattern at face value. More A than S looks like trait. The fix is to give the history, and to ask about transfusion yourself before reading any result.
Notice that the result is not useless. After an exchange transfusion, measuring the HbS that is left is exactly how the exchange is monitored. The figures used here, about 64% A and 36% S, come from a published example of just that.
For diagnosis, the handbook advises waiting about three months after a transfusion.
Sources. Hematology Handbook, chapter 6. Bain, Haemoglobinopathy Diagnosis, 3rd edition, 2020, figure 2.5.
Case 6
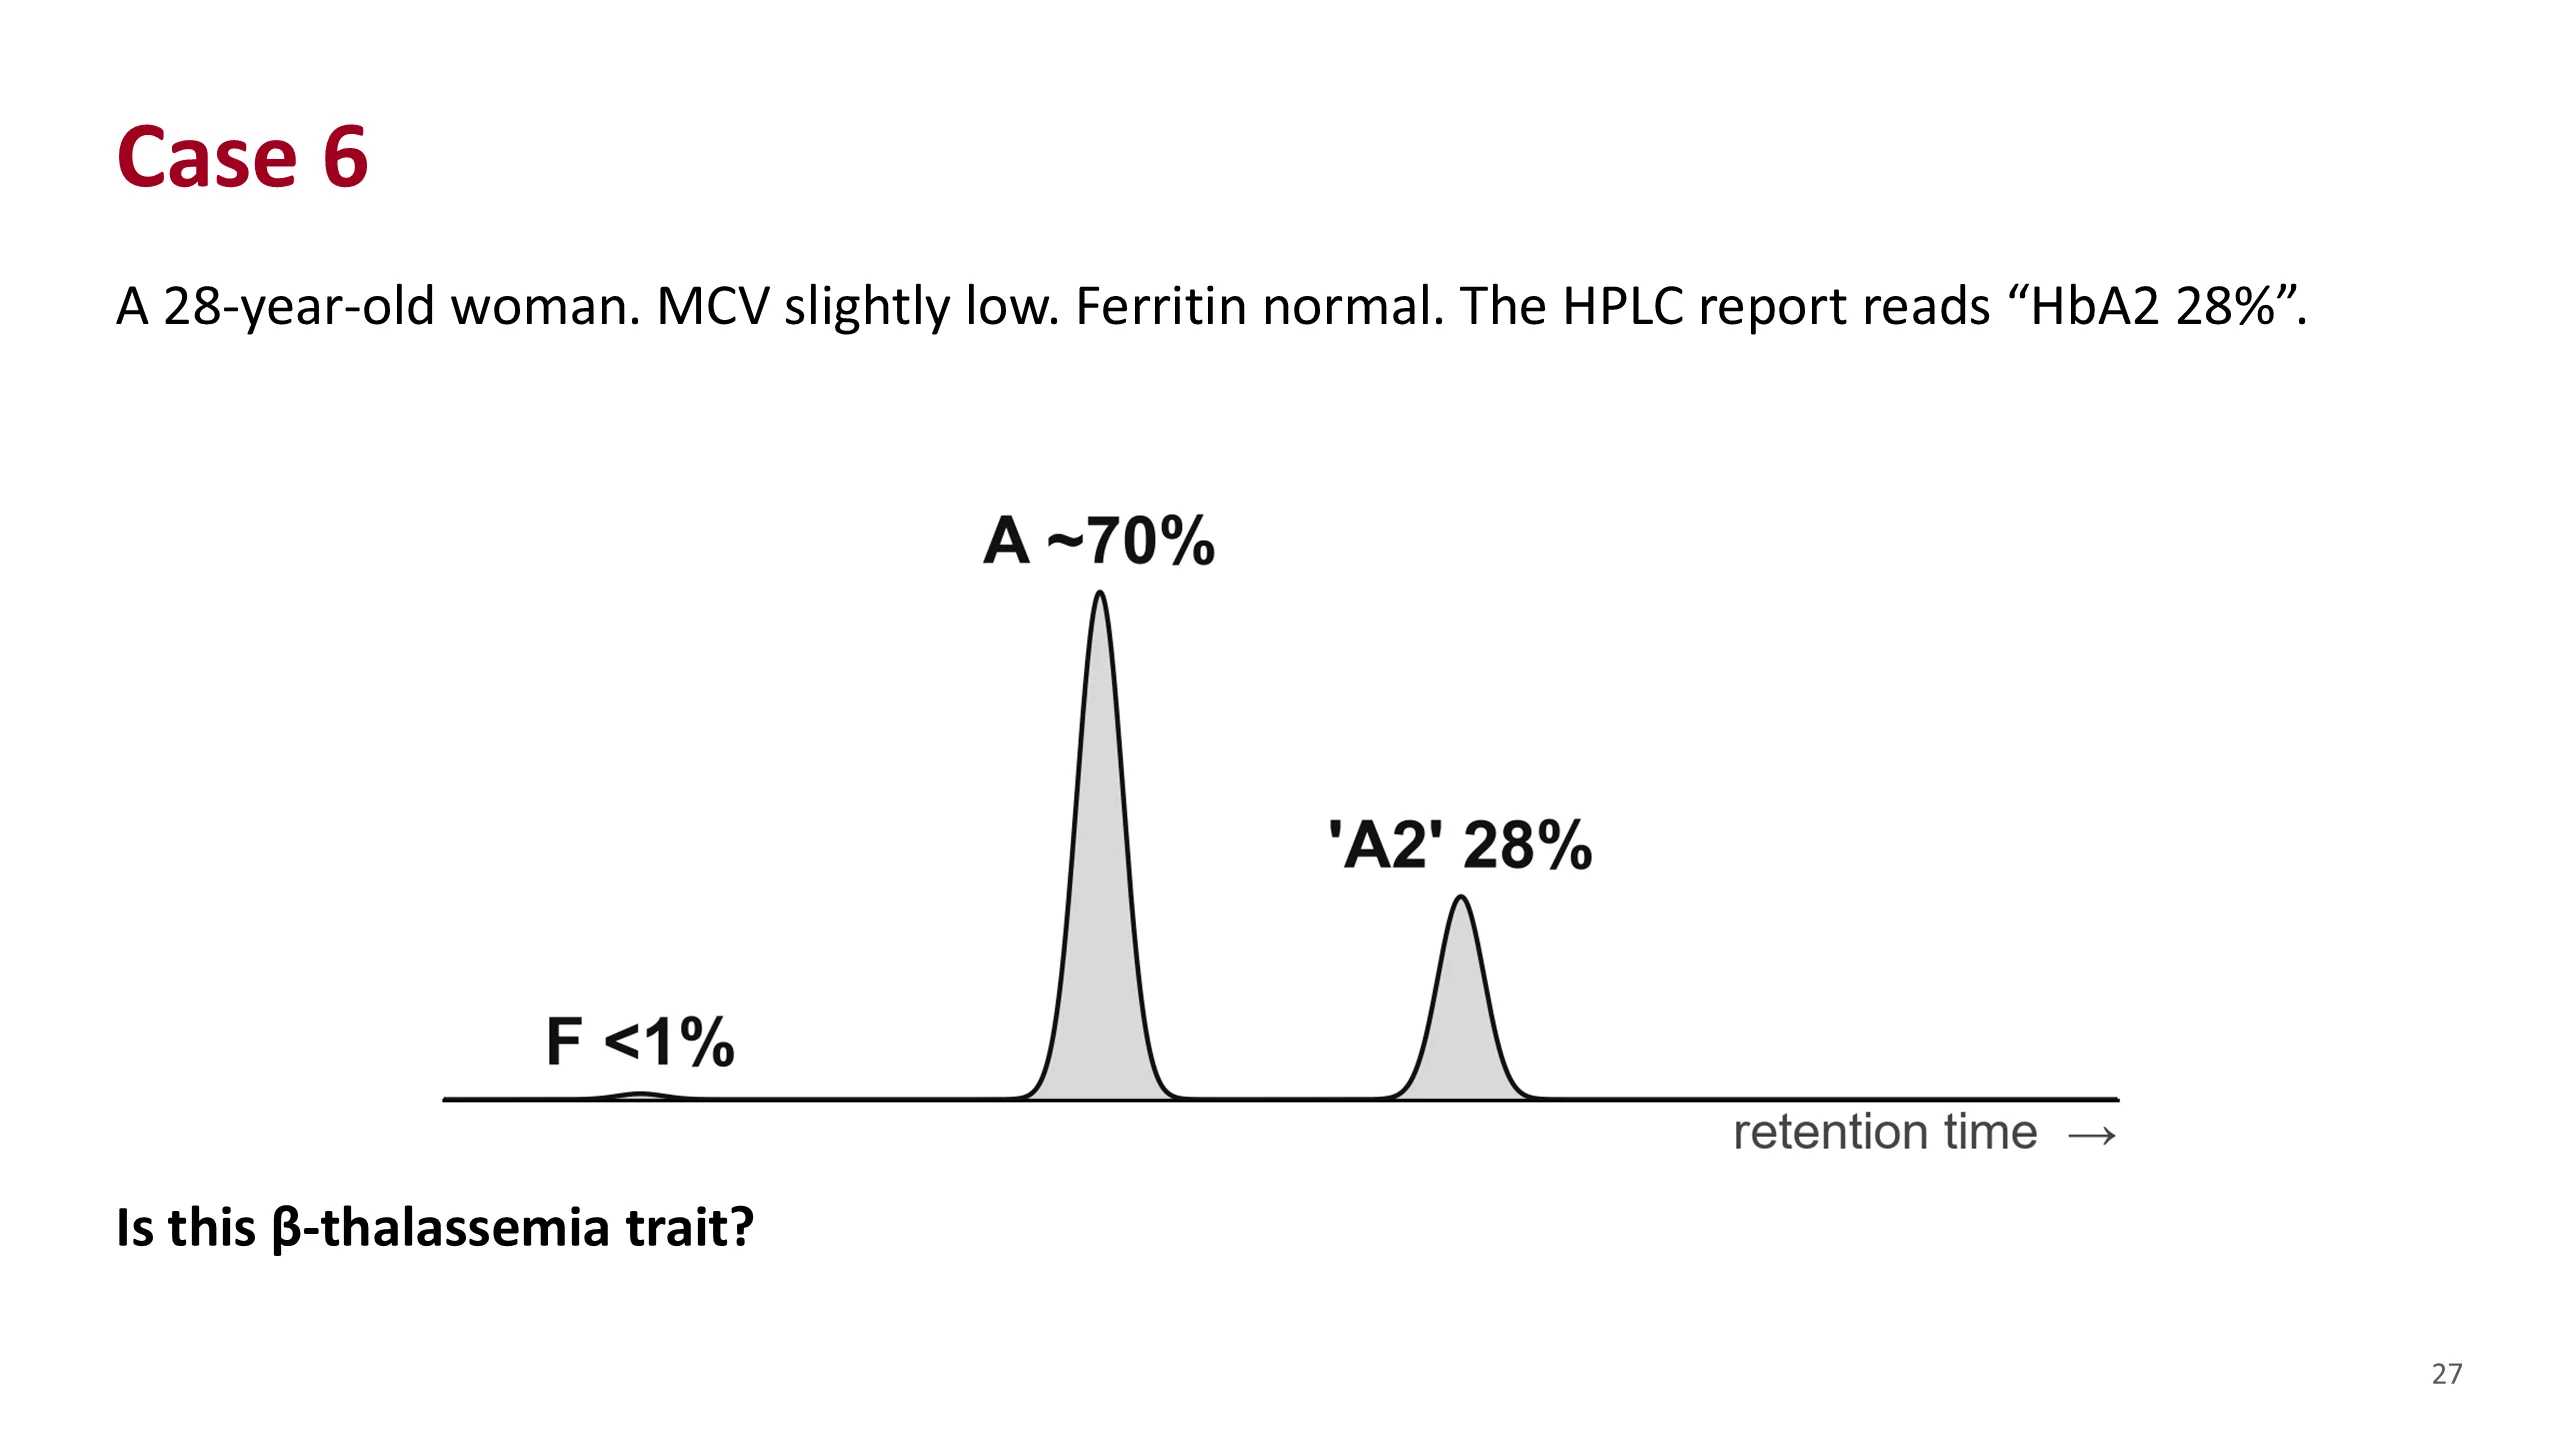
A young woman with slightly small cells and normal iron. The report prints an HbA2 of 28%.
Ask: is that beta-thalassemia trait? What A2 would you expect in beta-thalassemia trait?
Case 6: answer
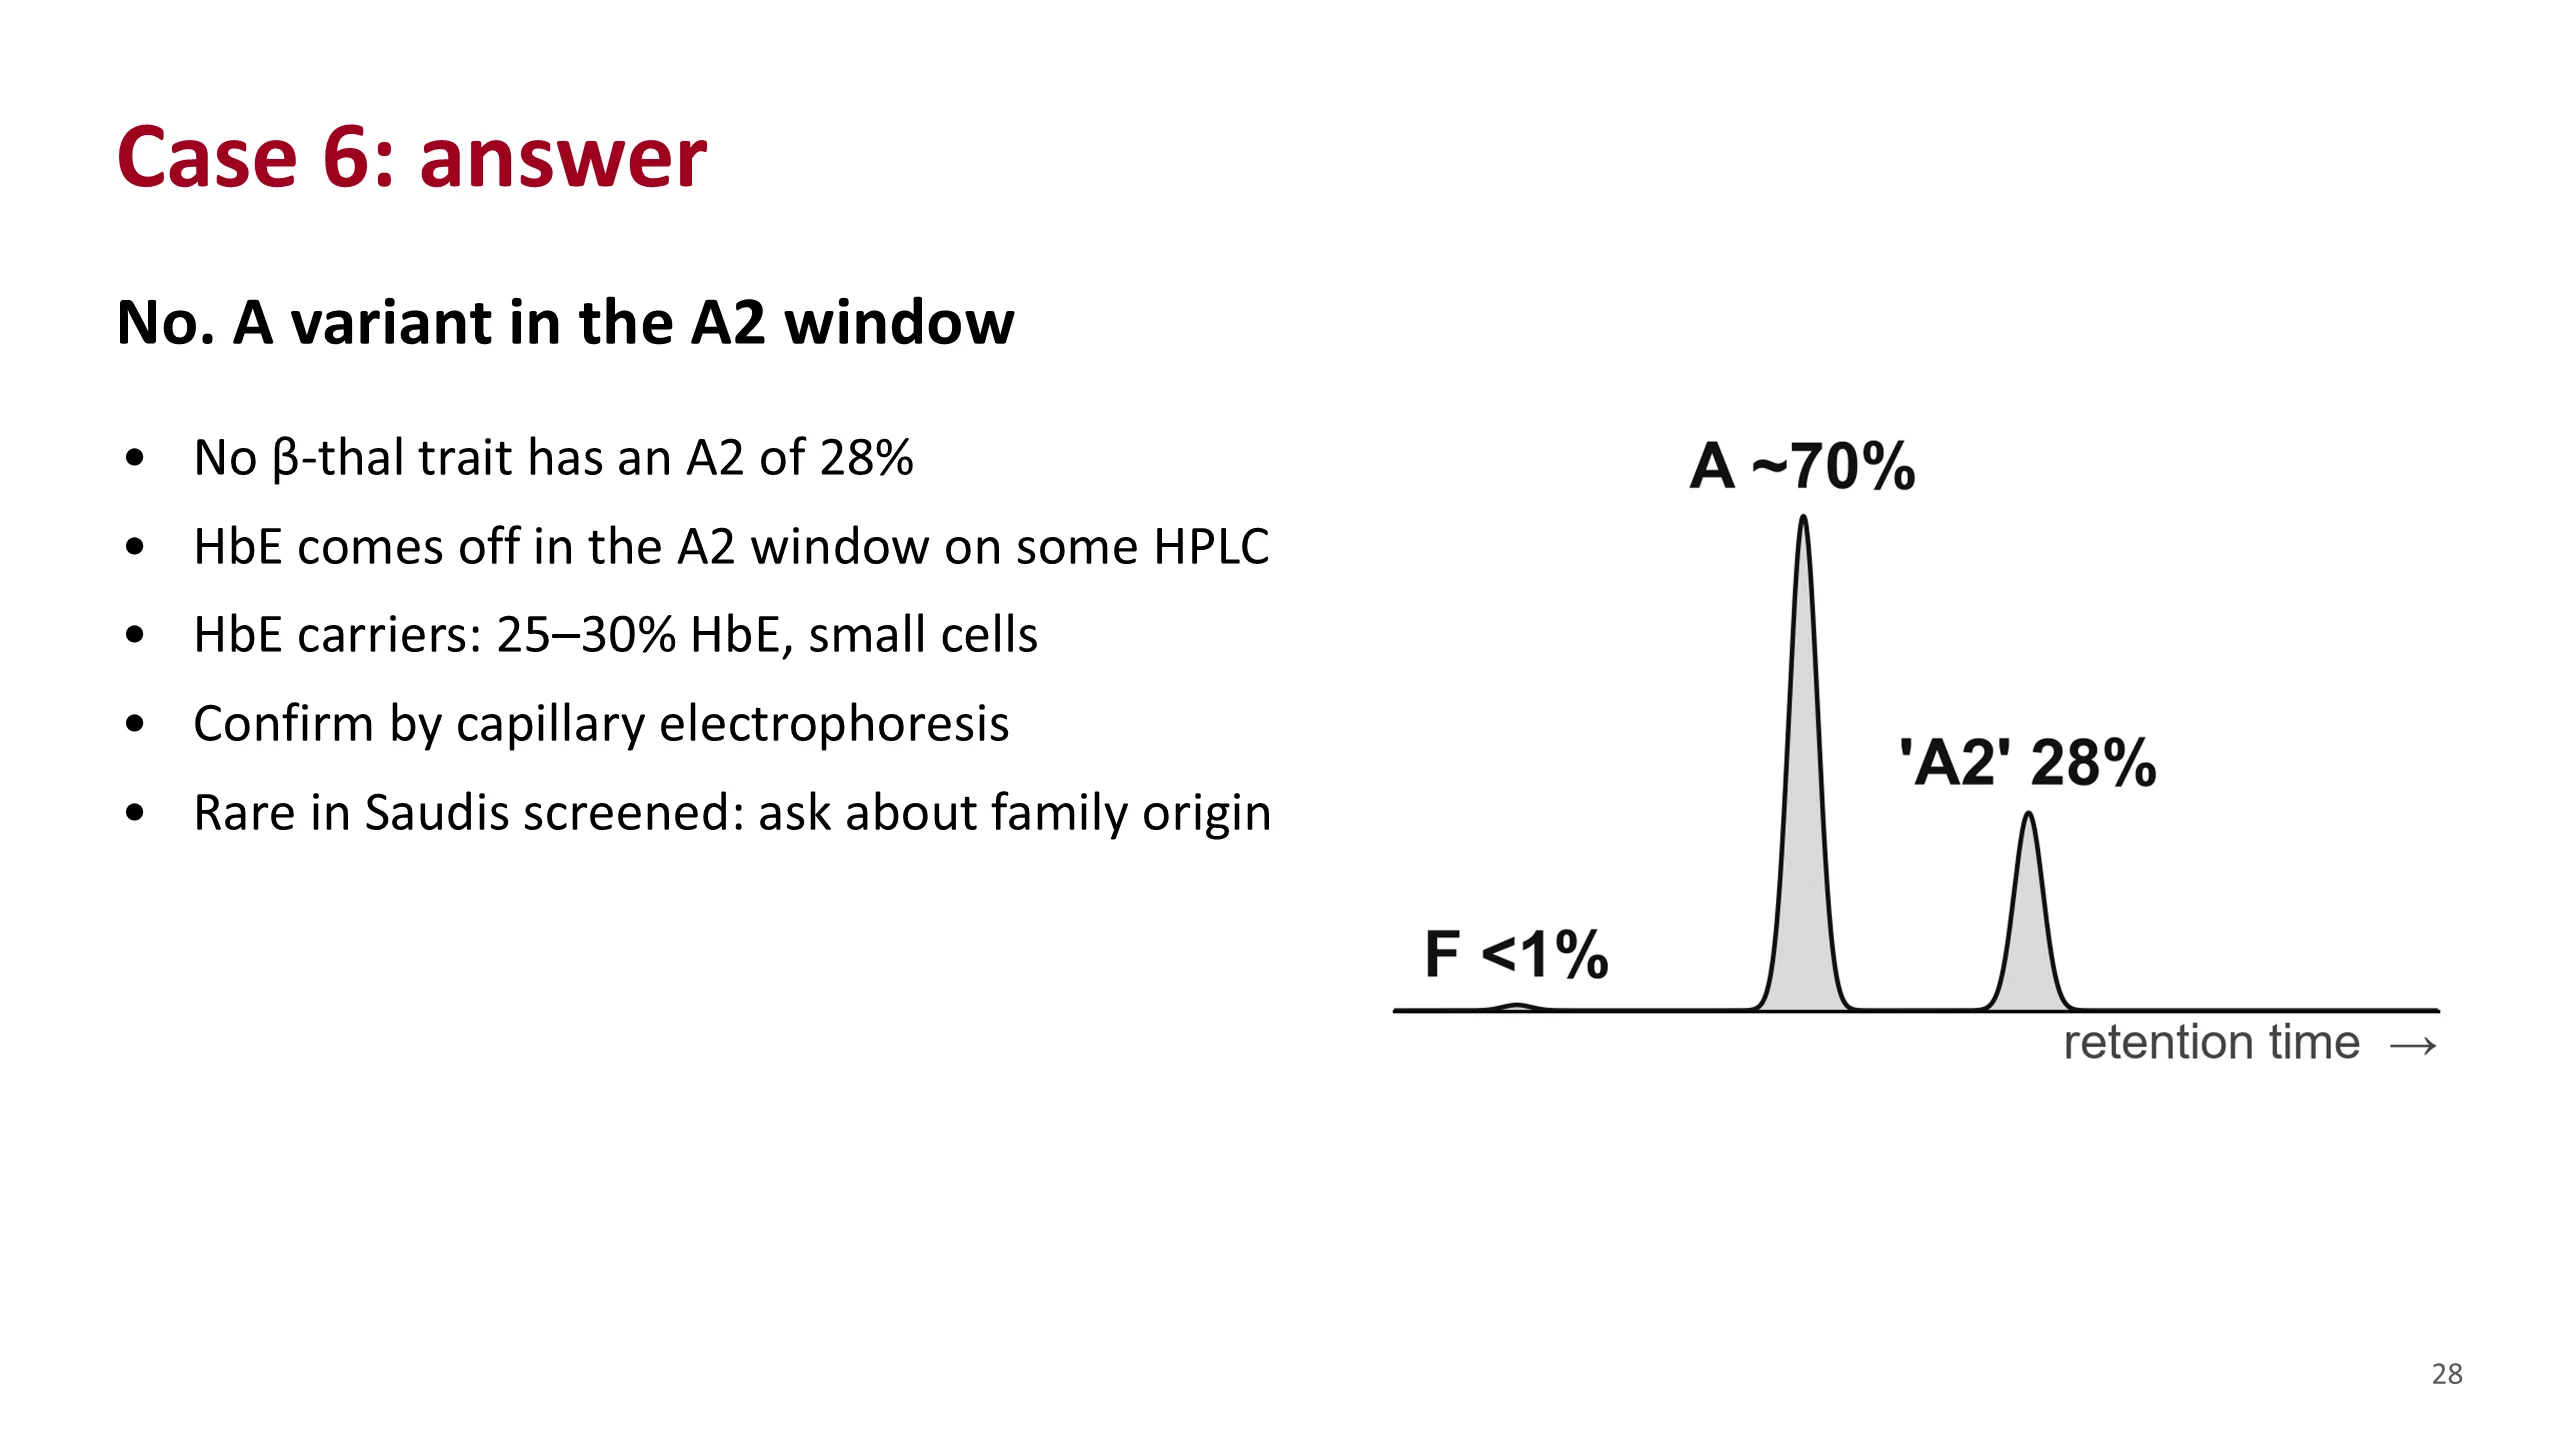
No. An A2 of 28% is far too high for beta-thalassemia trait. The peak in the A2 window is something else.
The likeliest answer is HbE trait. On some HPLC instruments HbE comes off in the same window as A2. HbE carriers usually have 25 to 30% HbE and slightly small cells, which fits.
Confirm it by another method. Capillary electrophoresis separates E from A2.
HbE is very rare among Saudis screened before marriage, 0.0007% in the 2011 to 2018 data. So ask where the family is from. Other variants can also fall in the A2 window, which is why confirmation matters.
Sources. Bain, Haemoglobinopathy Diagnosis, 3rd edition, 2020, chapters 2 and 5. Aljabry et al., J Epidemiol Glob Health 2024.
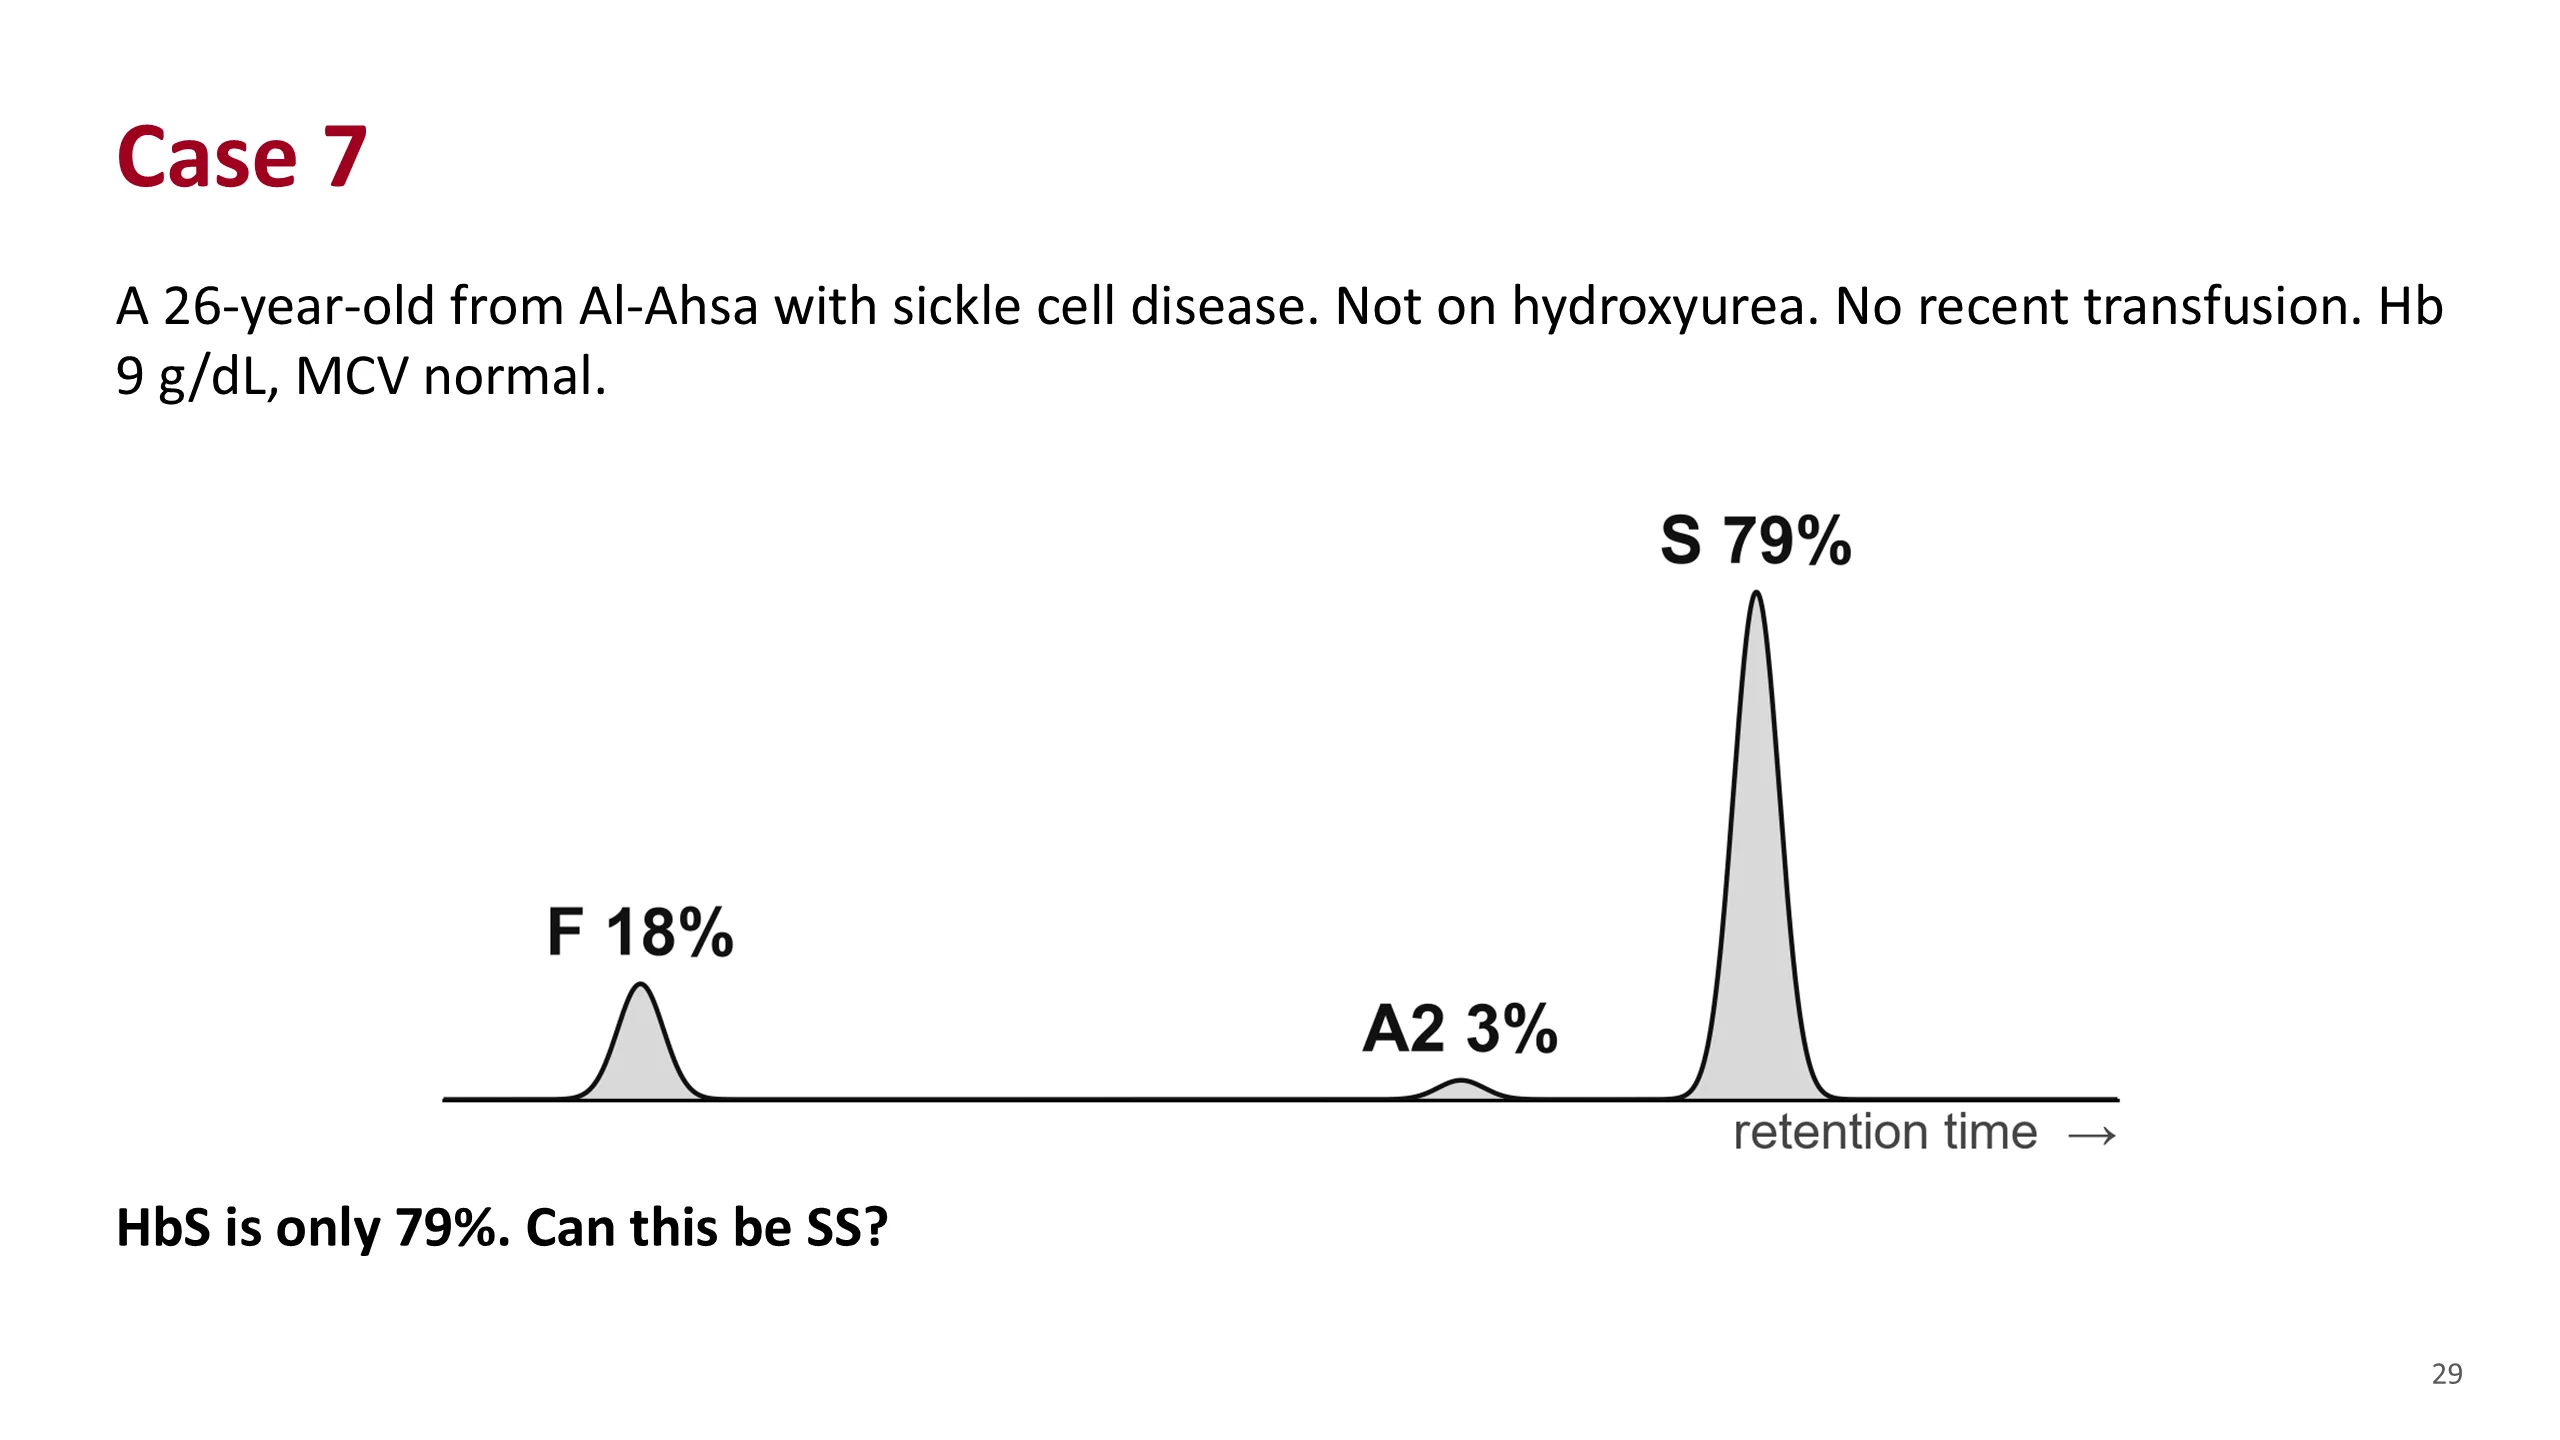
Case 7
A young man from Al-Ahsa in the Eastern Province with known sickle cell disease. He is not on hydroxyurea and has not been transfused.
HPLC: HbF 18%, A2 3%, HbS 79%, no HbA.
The table earlier said SS has 90% or more HbS. Ask the class whether this can be SS.
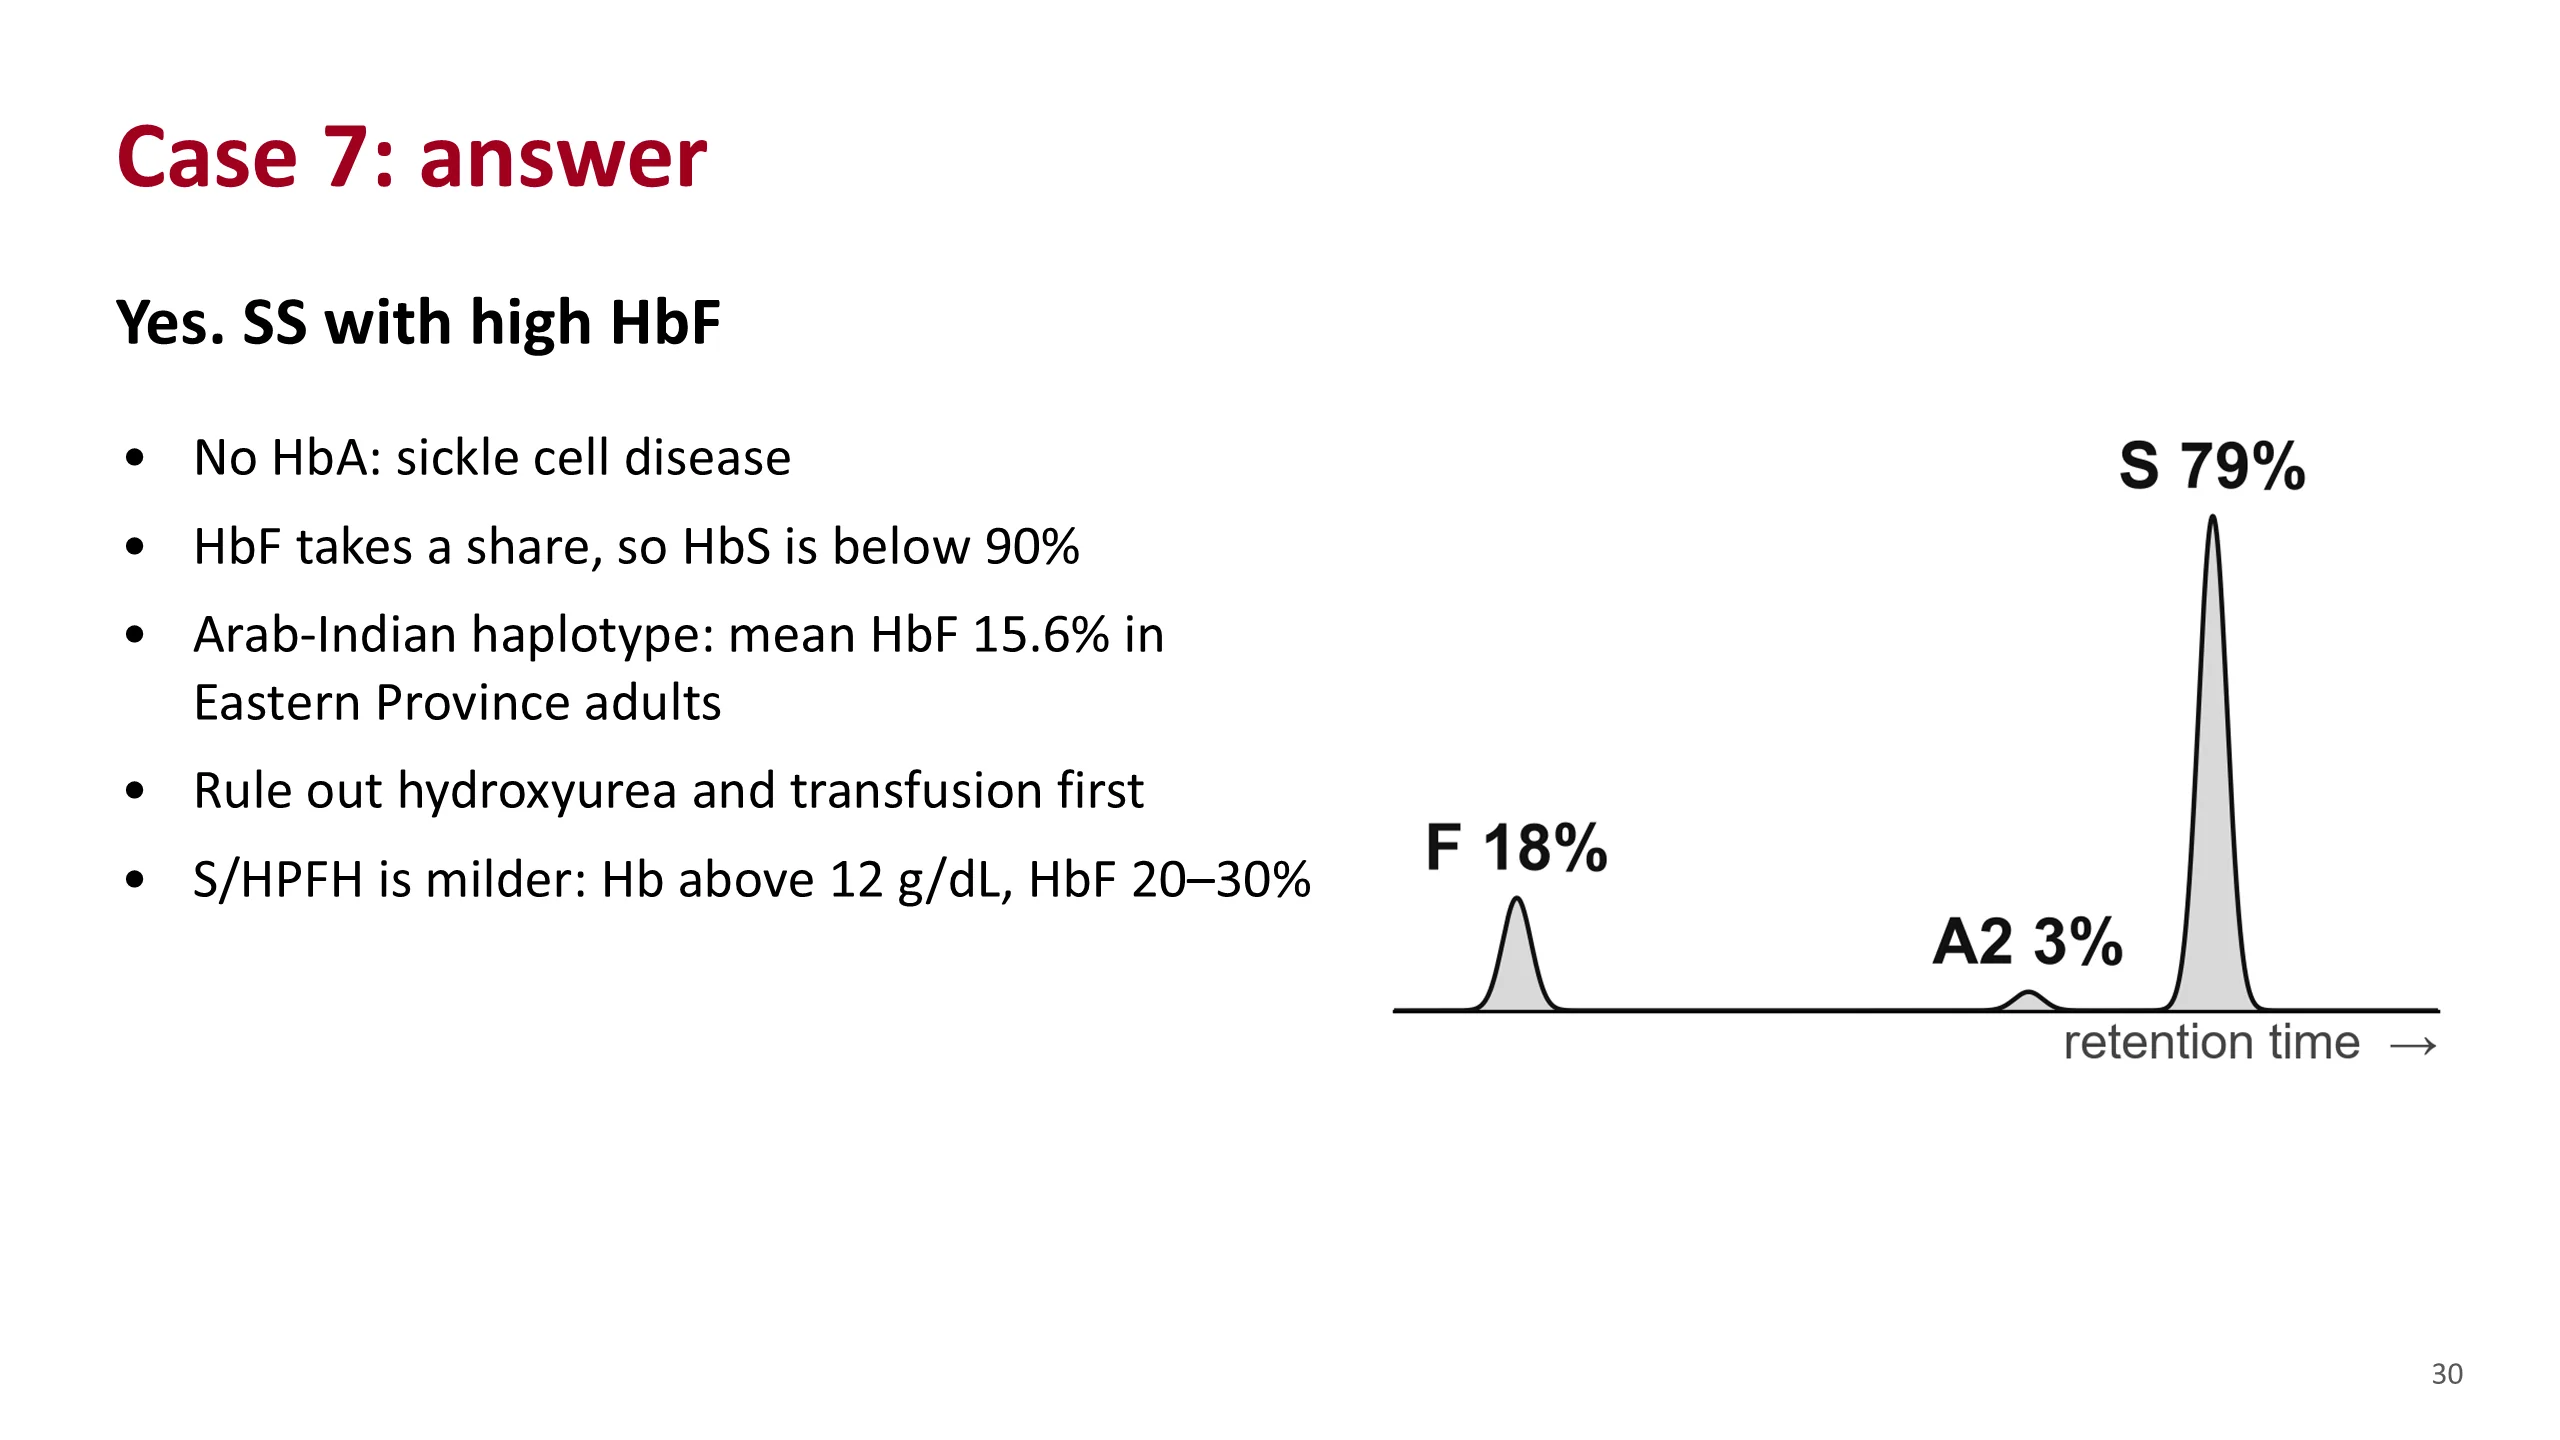
Case 7: answer
Yes. This fits SS.
There is no HbA, so this is sickle cell disease. HbS is below 90% because HbF takes up 18% of the total. In the Eastern Province the sickle gene sits on the Arab-Indian haplotype, which carries a high HbF. In 104 adults from Al-Ahsa the mean HbF was 15.6%.
The 90% figure is a classic value. It does not fit every Saudi patient. Do not reject SS on that alone.
First rule out the two things that raise HbF or lower HbS from outside: hydroxyurea and transfusion. Both were excluded here.
Then think of S with HPFH. That is a much milder condition, with a hemoglobin above 12 g/dL and an HbF of 20 to 30%. His hemoglobin of 9 makes it unlikely.
A high HbF is not a promise of mild disease. The same study found that adults with this haplotype still had frequent pain crises and acute chest syndrome.
Sources. Alsultan et al., Br J Haematol 2014. Bain, Haemoglobinopathy Diagnosis, 3rd edition, 2020, chapter 4, table 4.8. Anemia Part 3, slide 14.
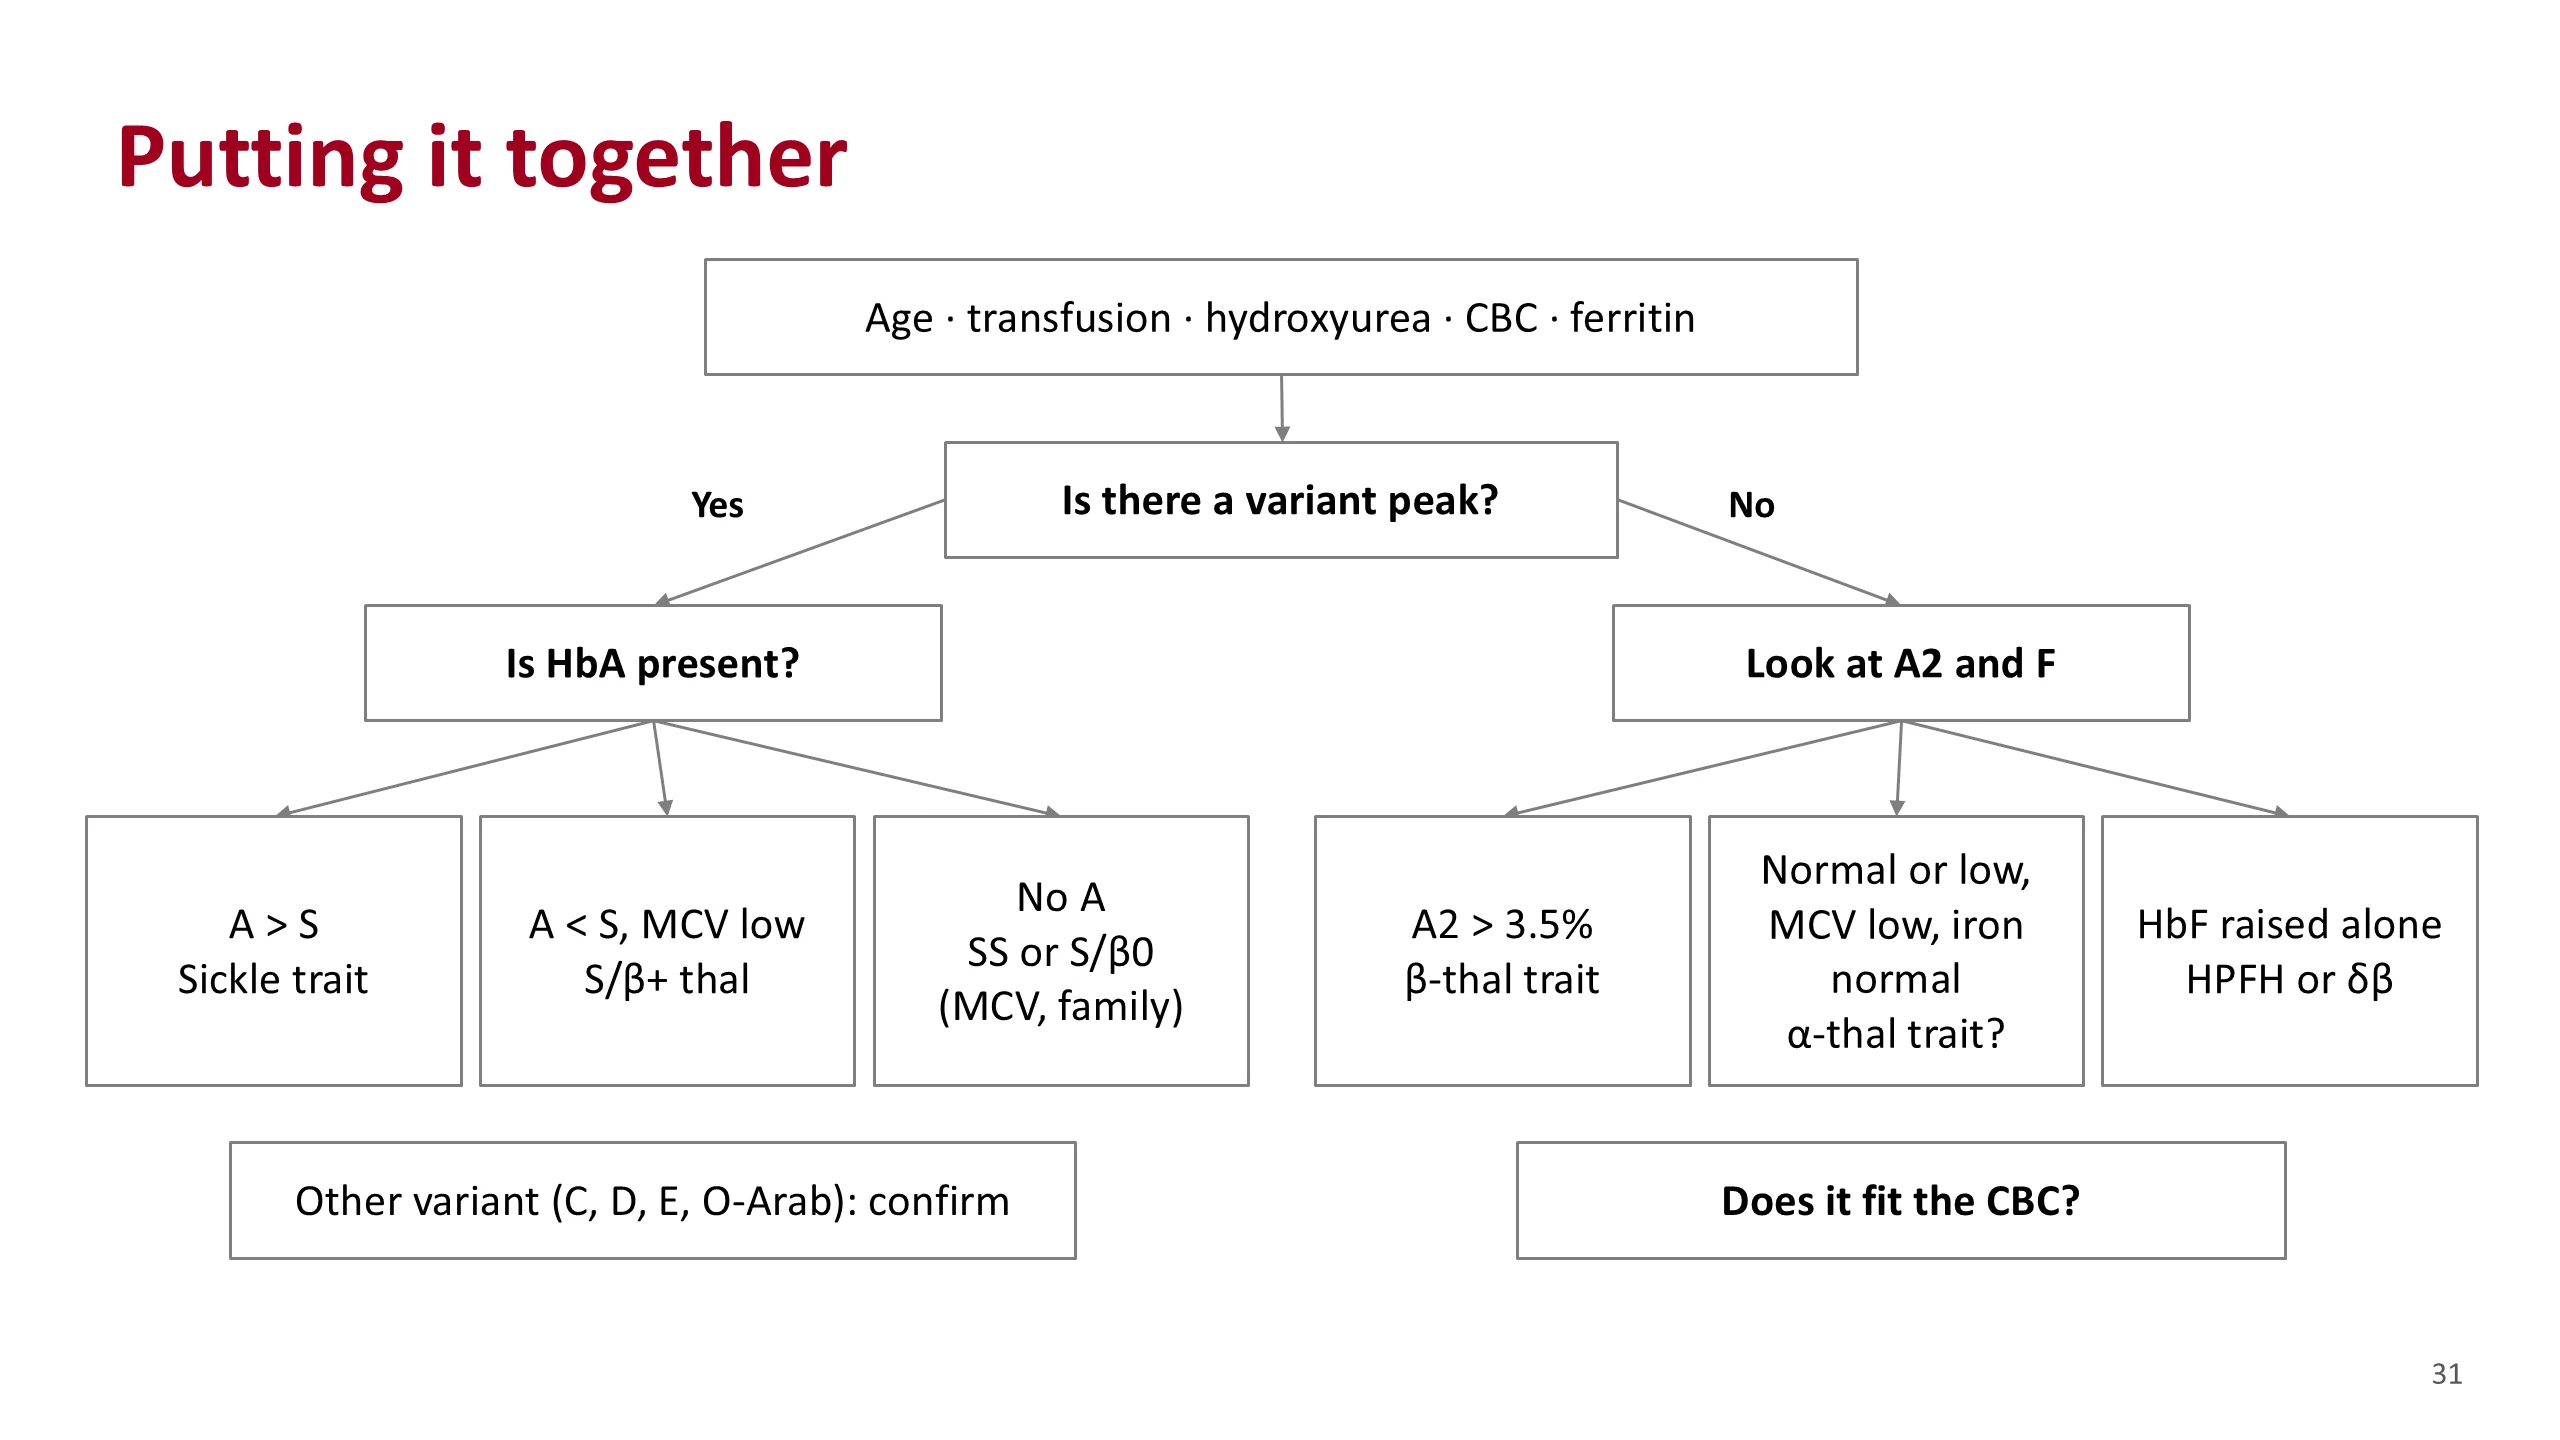
Putting it together
This is the whole lecture on one slide.
Start before the peaks: the patient's age, any transfusion or hydroxyurea, the blood count and the iron status.
Then one question splits the road. Is there a variant peak?
If yes, ask whether HbA is present. More A than S is sickle trait. Less A than S, with small cells, is S/beta-plus thalassemia. No HbA at all is SS or S/beta-zero; the MCV and the family tell them apart. Any other variant, C, D, E or O-Arab, is confirmed by a second method.
If there is no variant, look at the proportions. A2 above 3.5% is beta-thalassemia trait. A normal or low pattern with small cells and normal iron is probably alpha-thalassemia trait, confirmed by DNA when it matters. A raised HbF alone suggests HPFH or delta-beta thalassemia, and the blood count decides between them.
And at the end of every road: does the result fit the blood count?
Sources. Hematology Handbook, chapter 6, and the sources on the earlier slides.
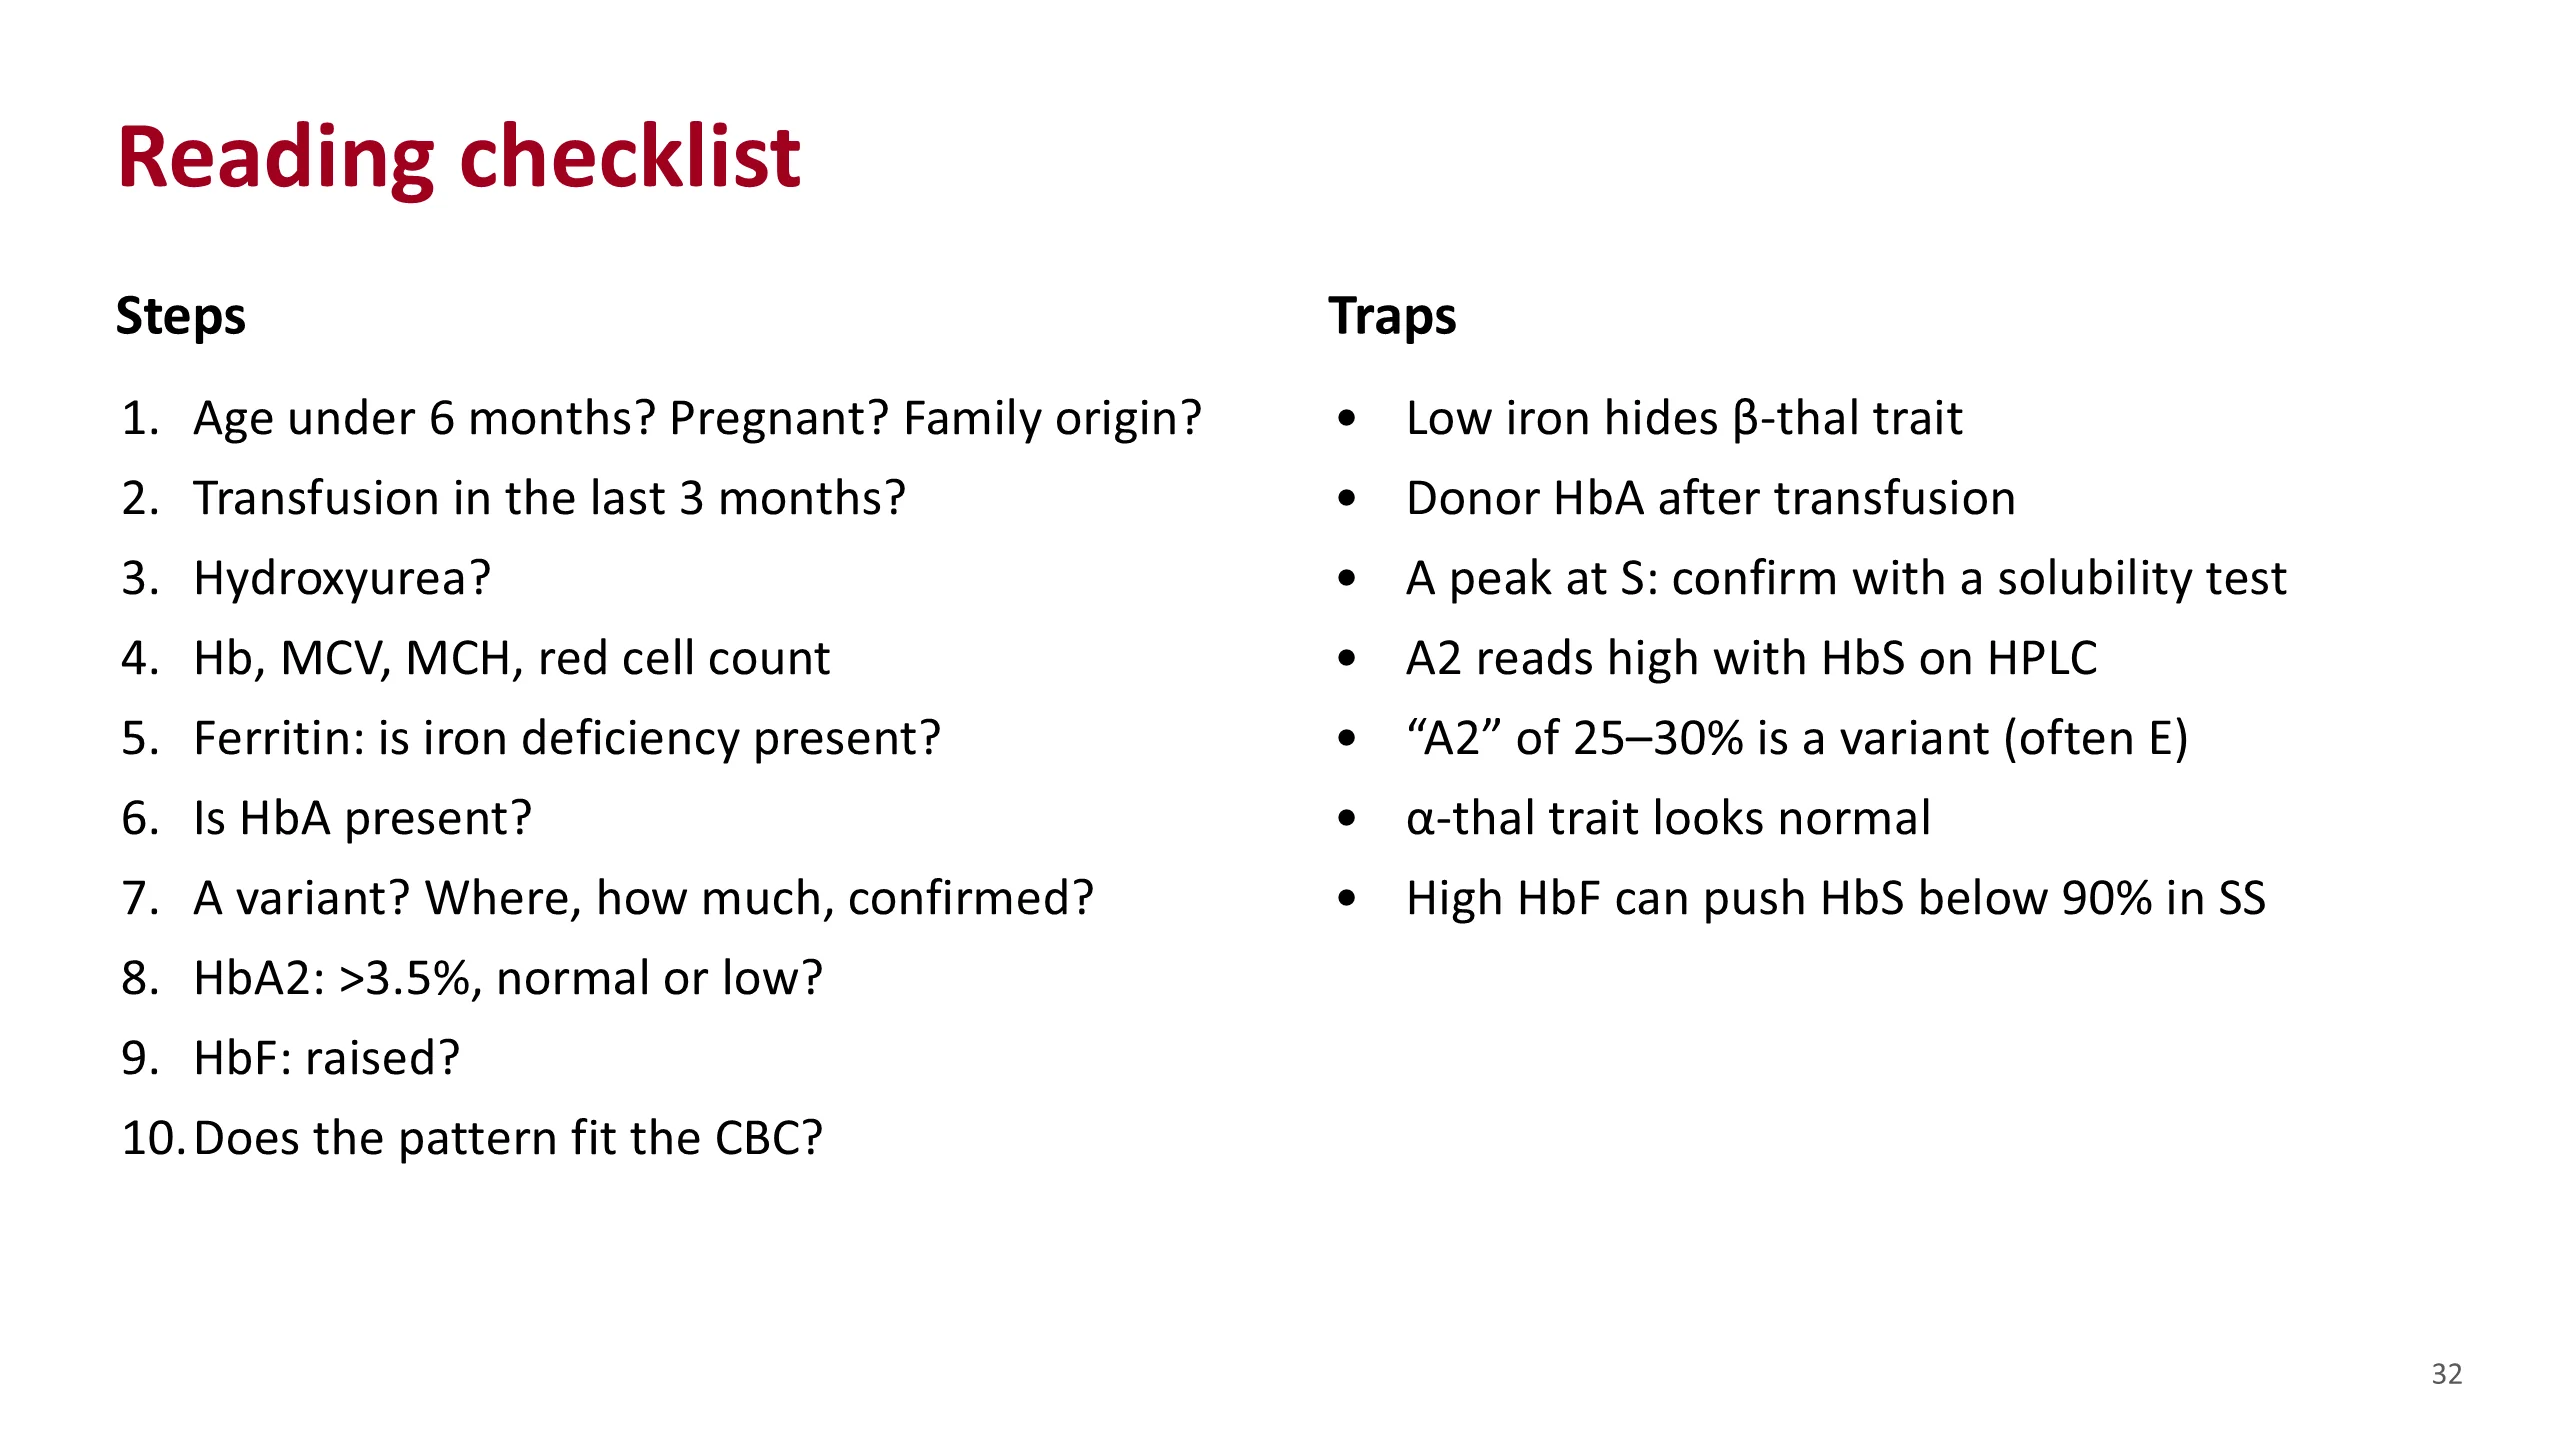
Reading checklist
This is the one page to keep. It is the routine from earlier, with the traps attached to the steps where they bite.
Read it top to bottom on every report until you no longer need to. Before the peaks: age, transfusion, hydroxyurea, the blood count and the iron. Then the peaks: HbA, the variant and its confirmation, A2, F. Then the fit with the blood count.
The right-hand column lists the traps from the pitfalls slide.
Sources. Hematology Handbook, chapter 6, and the sources on the earlier slides.