Multiple Myeloma
From pathogenesis to diagnosis — the plasma-cell clone, CRAB, and the diagnostic triad.
These slides are an outline only. Read the accompanying material with them: the notes under each slide below, and the Multiple Myeloma and Plasma Cell Disorders chapter of the Hematology Handbook. Then work through the Internal Medicine Casebook and the Hematology Question Bank.
What this lecture is about
These slides are an outline only. Read the accompanying material with them: the notes under each slide on this page, and the Multiple Myeloma and Plasma Cell Disorders chapter of the Hematology Handbook. Then work through the Internal Medicine Casebook and the Hematology Question Bank.
Multiple myeloma is a cancer of the plasma cell, the antibody factory of the immune system. It is worth learning well for two reasons: it is common enough that every physician will meet it, and its presentation is scattered across so many systems (bones, kidneys, blood, calcium, nerves) that it is missed unless you know to put the pieces together.
The lecture is built around a single patient, introduced on the next slide, and follows him to his diagnosis. Along the way it covers the normal plasma cell and what happens when one clone of it escapes control; how that clone is detected in the blood by protein electrophoresis; the spectrum from a harmless paraprotein to symptomatic disease; the four kinds of organ damage summarised as CRAB; and the three criteria that confirm the diagnosis.
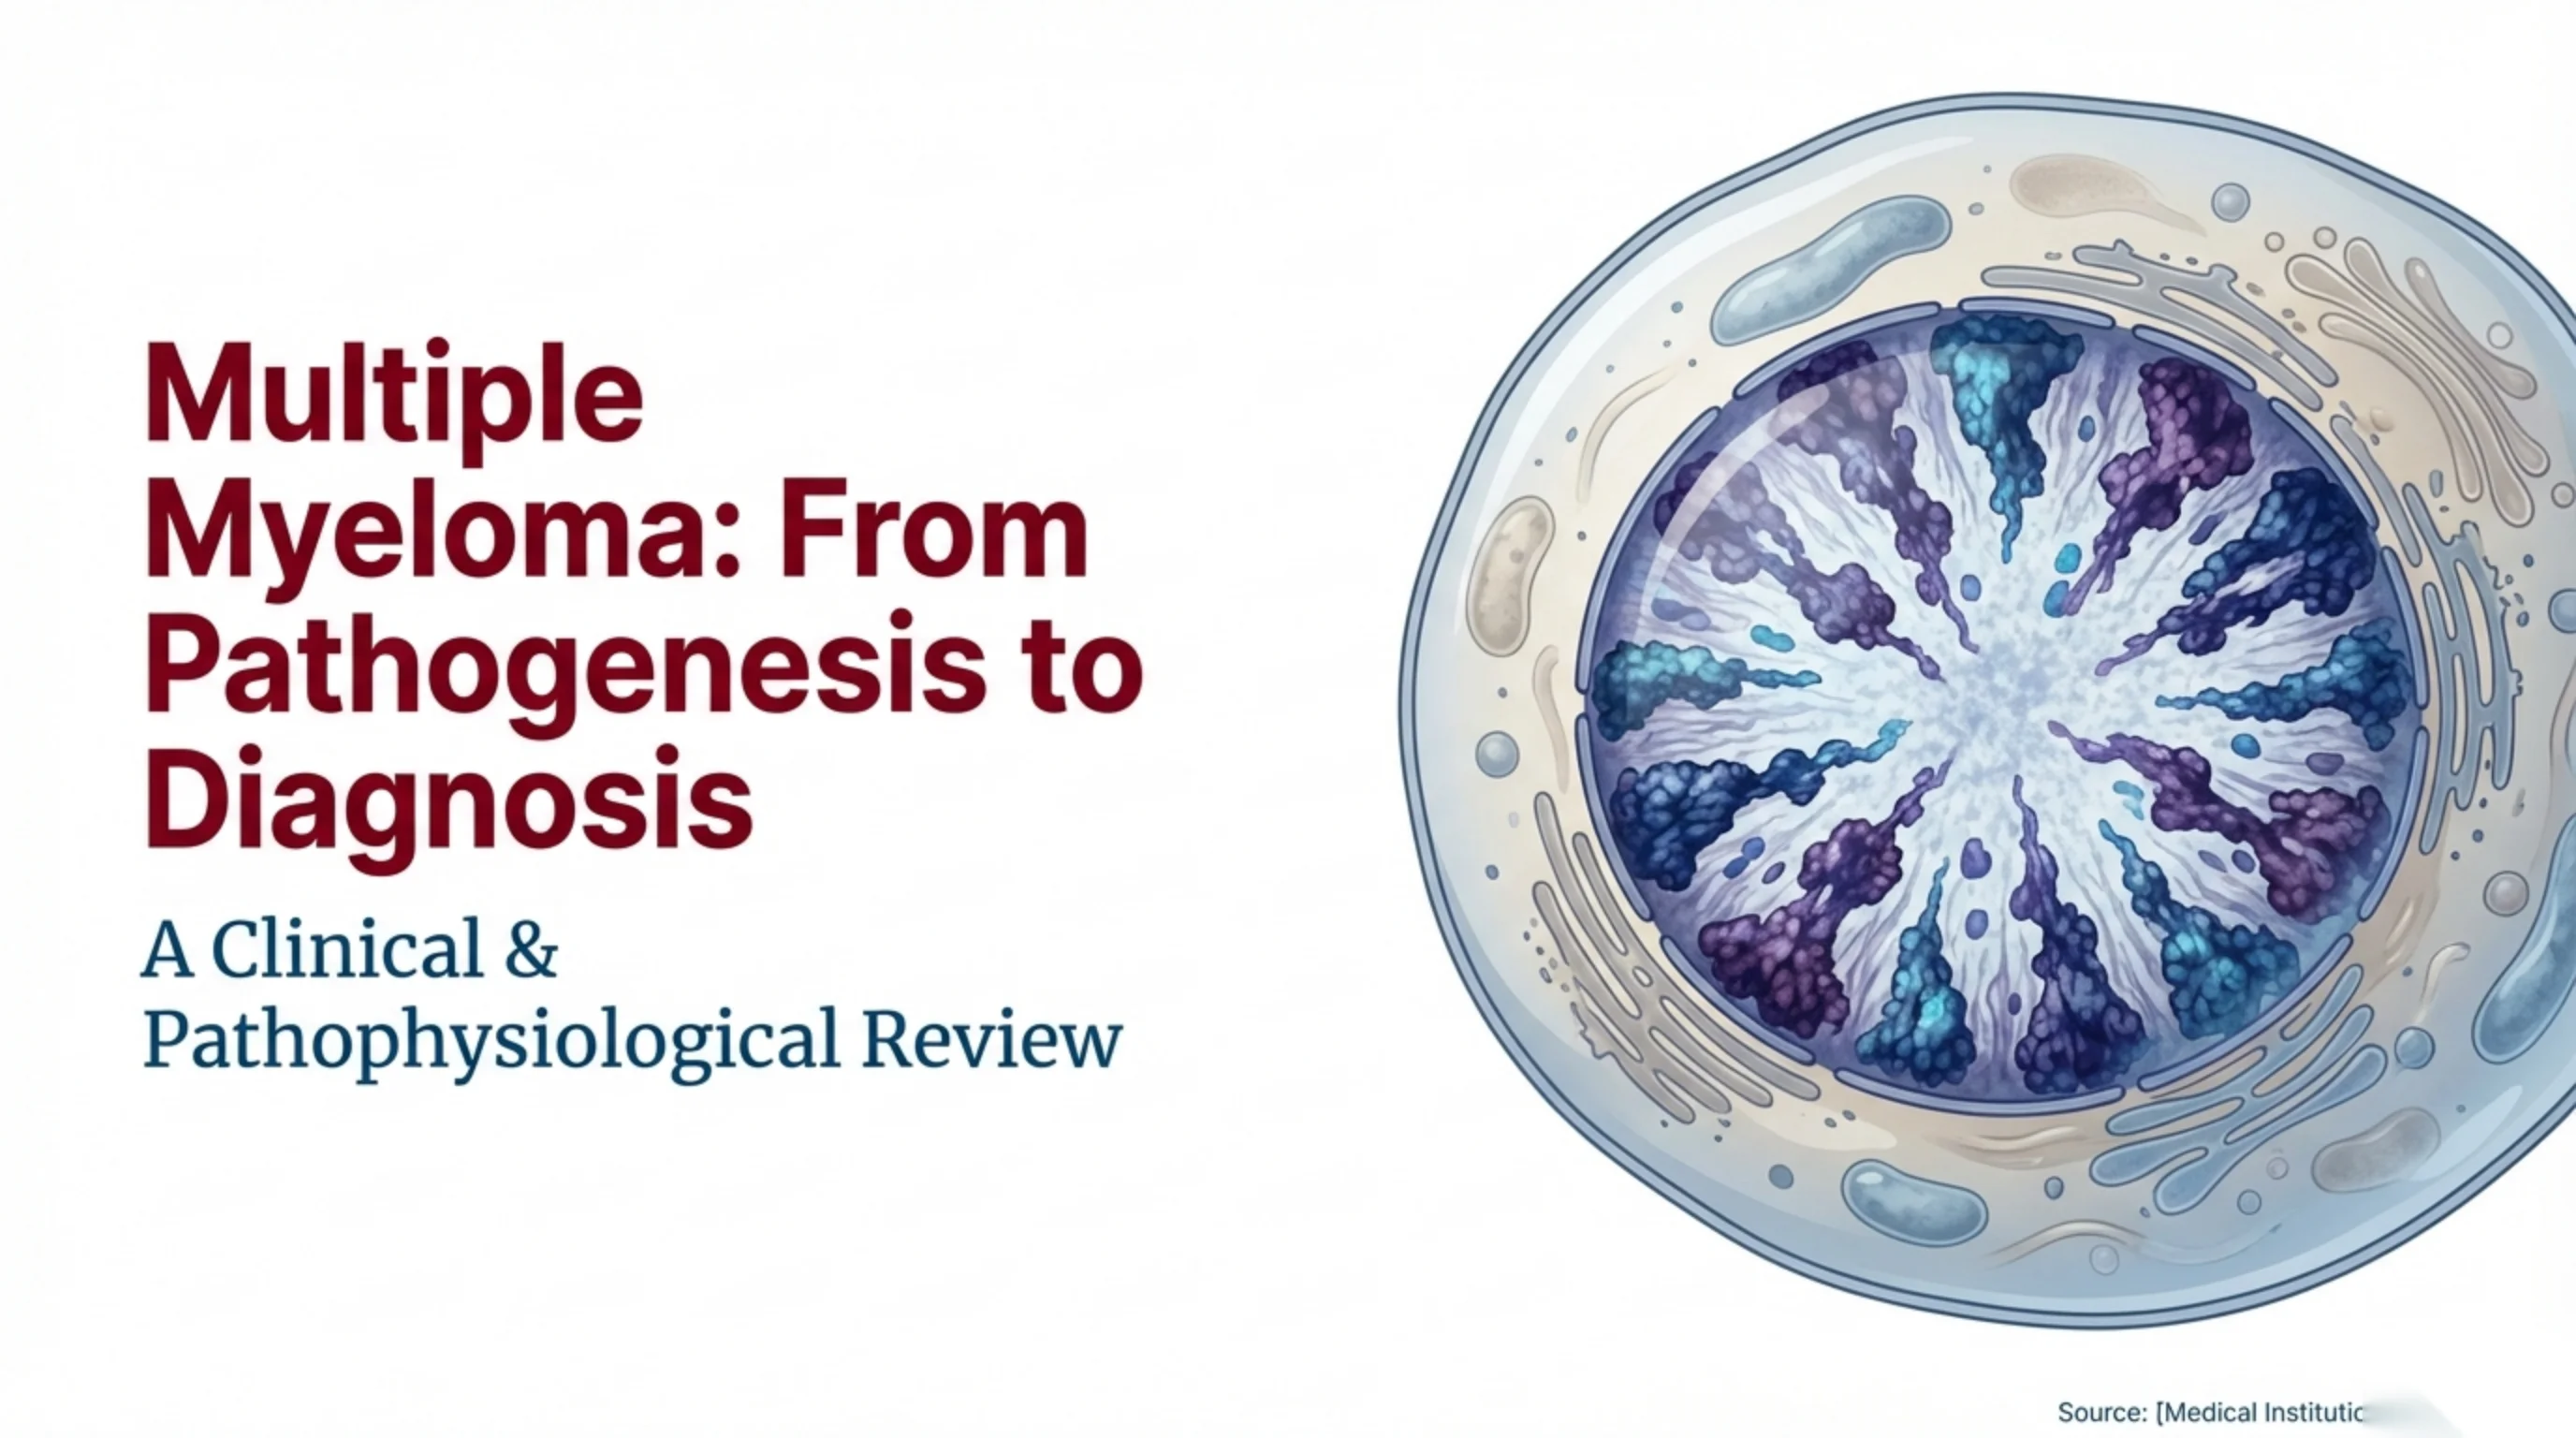
The cell on the title slide is a plasma cell. Notice the nucleus with its clumped chromatin arranged like the numbers on a clock face. You will be asked to recognise that cell again on a bone marrow smear near the end.
The case: fatigue, and four numbers that do not belong together
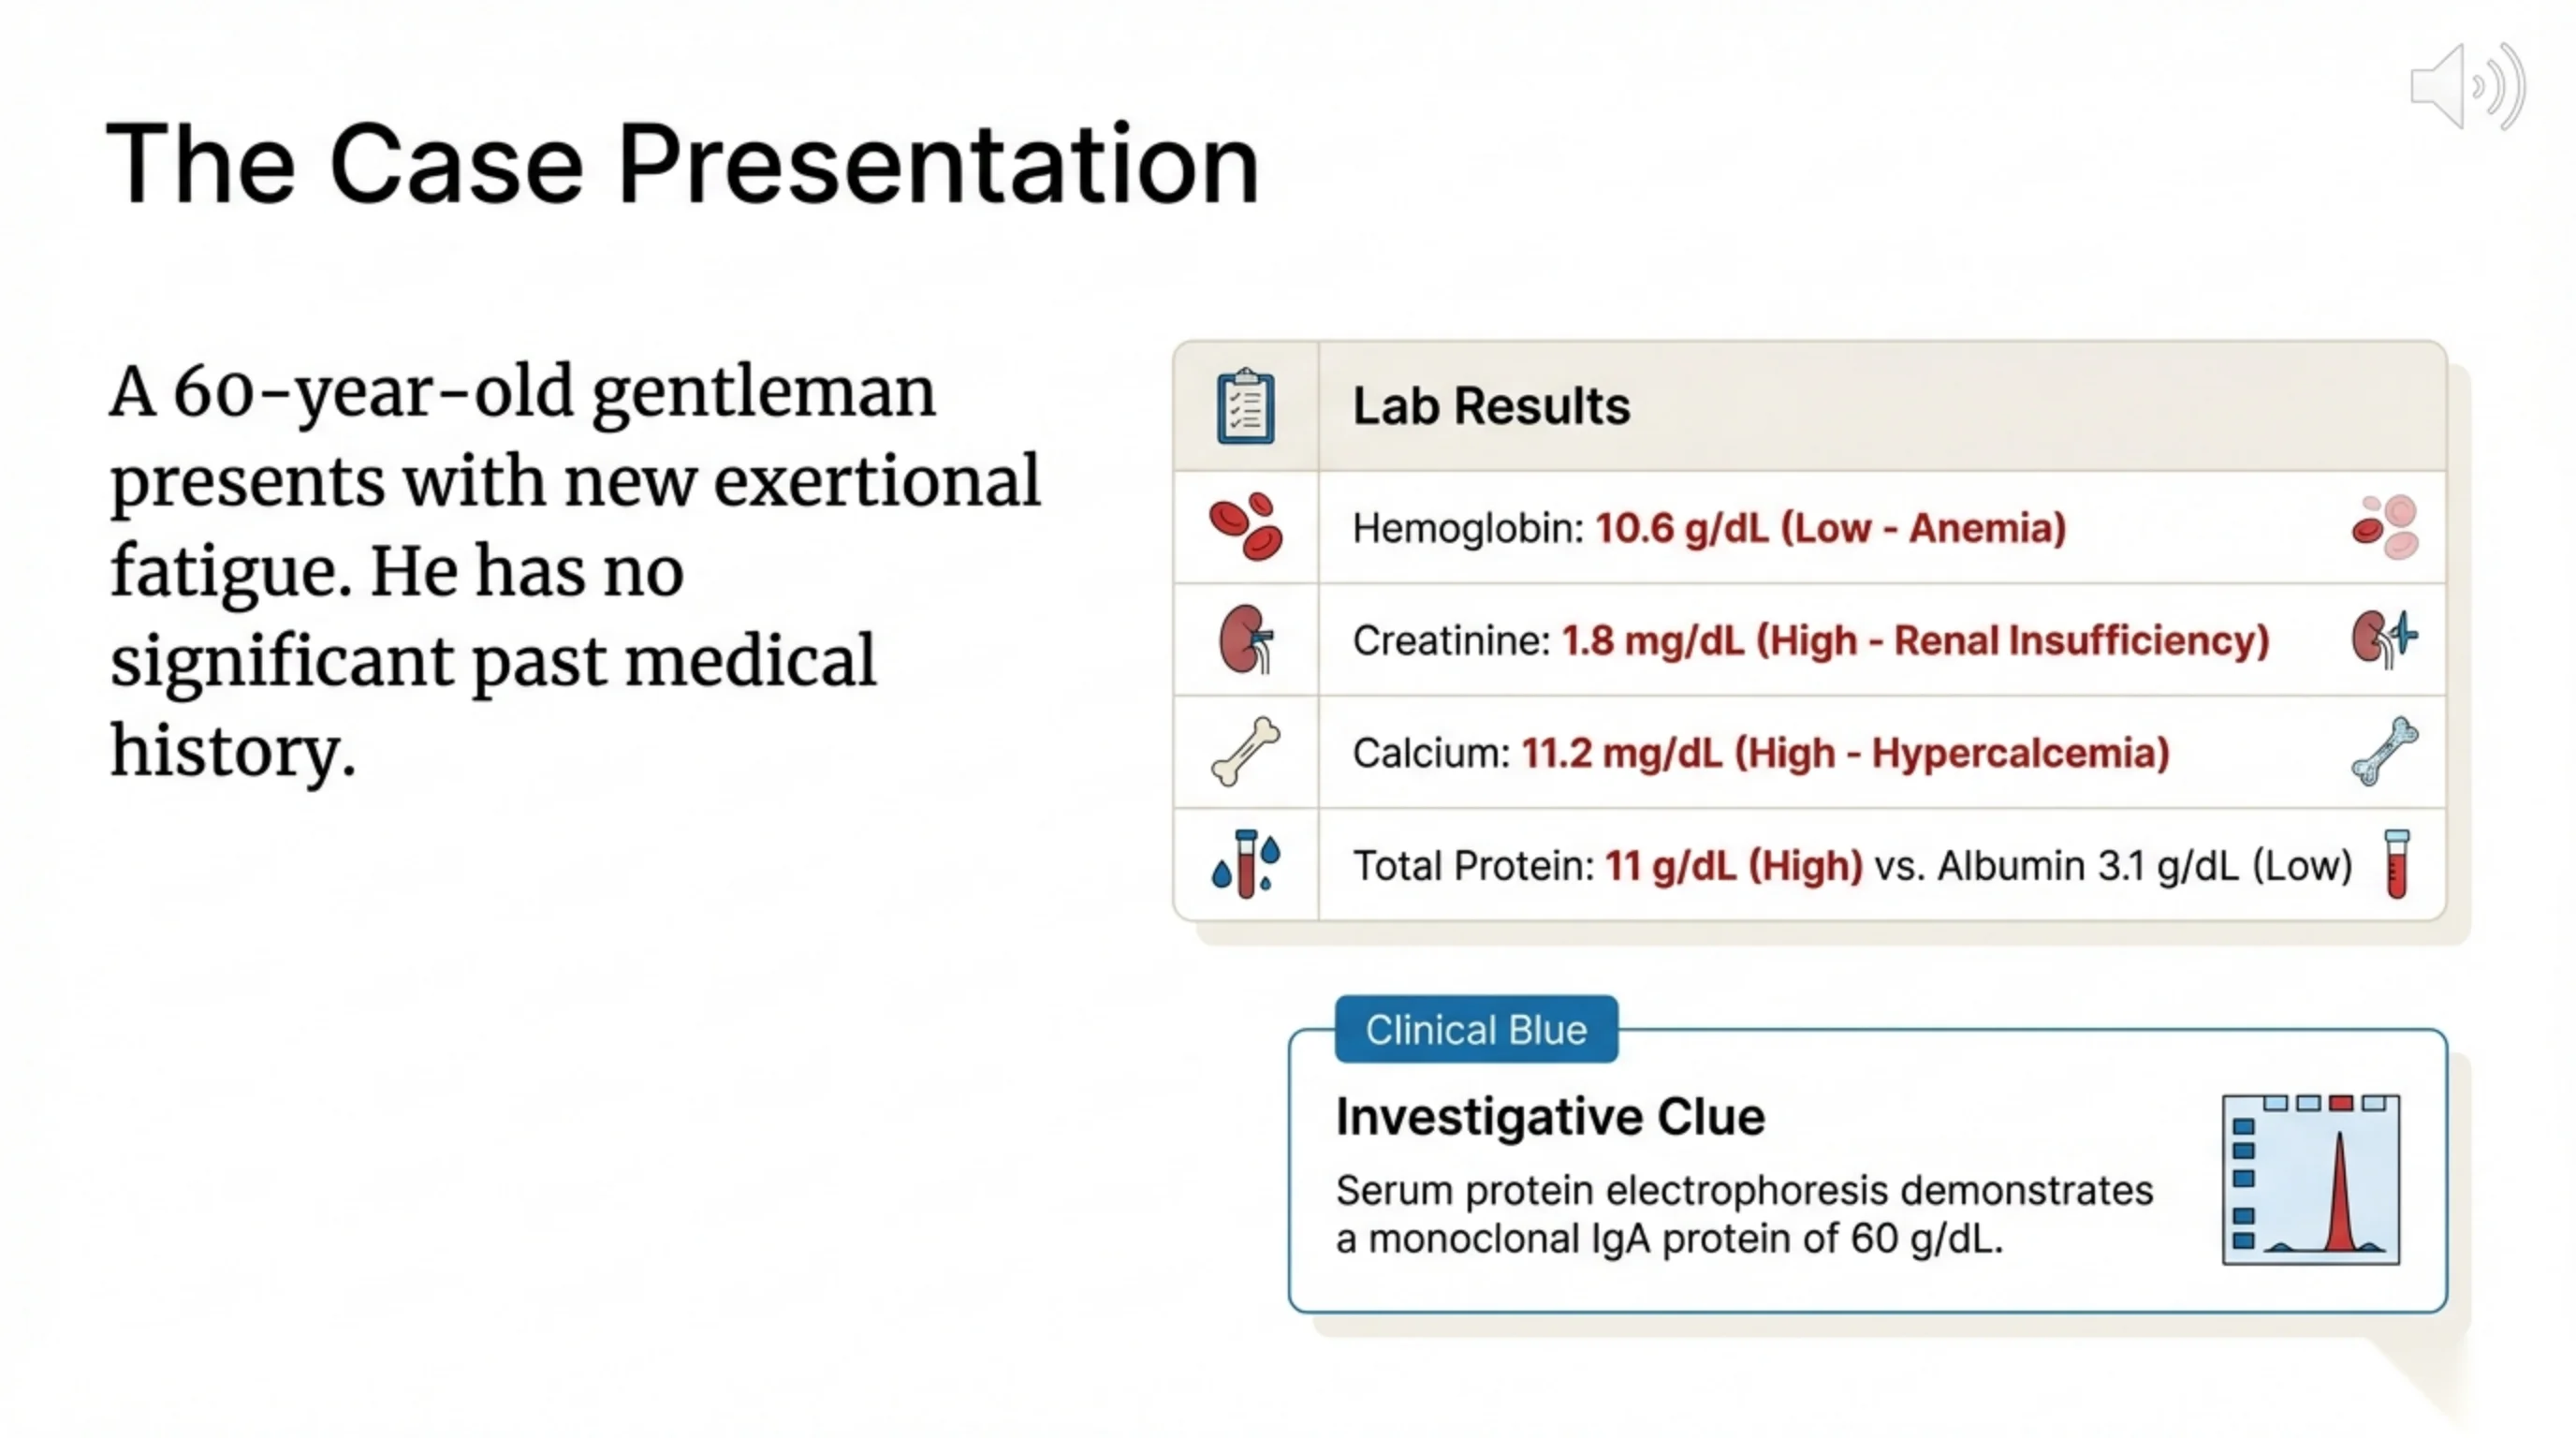
A 60-year-old man with no past history presents with new breathlessness on exertion. Nothing about the story is specific. The diagnosis is in the blood tests, and the skill this slide teaches is reading four results together rather than one at a time.
The hemoglobin of 10.6 g/dL explains the symptom: he is anemic. The creatinine of 1.8 mg/dL says his kidneys are failing. The calcium of 11.2 mg/dL is high. Any one of these has a long differential. Seen together in a man of sixty they already form three quarters of the CRAB pattern you will meet on slide 10, and that combination should make you think of myeloma before you have done anything else.
The fourth result is the clue that clinches it. Total protein is 11 g/dL, which is high, yet albumin is only 3.1 g/dL, which is low. Total protein is albumin plus globulins, so if the total is high while albumin is low, the globulins must be very high. Something is making a large amount of protein that is not albumin. Serum protein electrophoresis, the test that separates those proteins, shows a single monoclonal IgA protein at a concentration of 6 g/dL. The next slides explain what that means and why it is so large.
The cell of origin: a B cell at the end of its journey
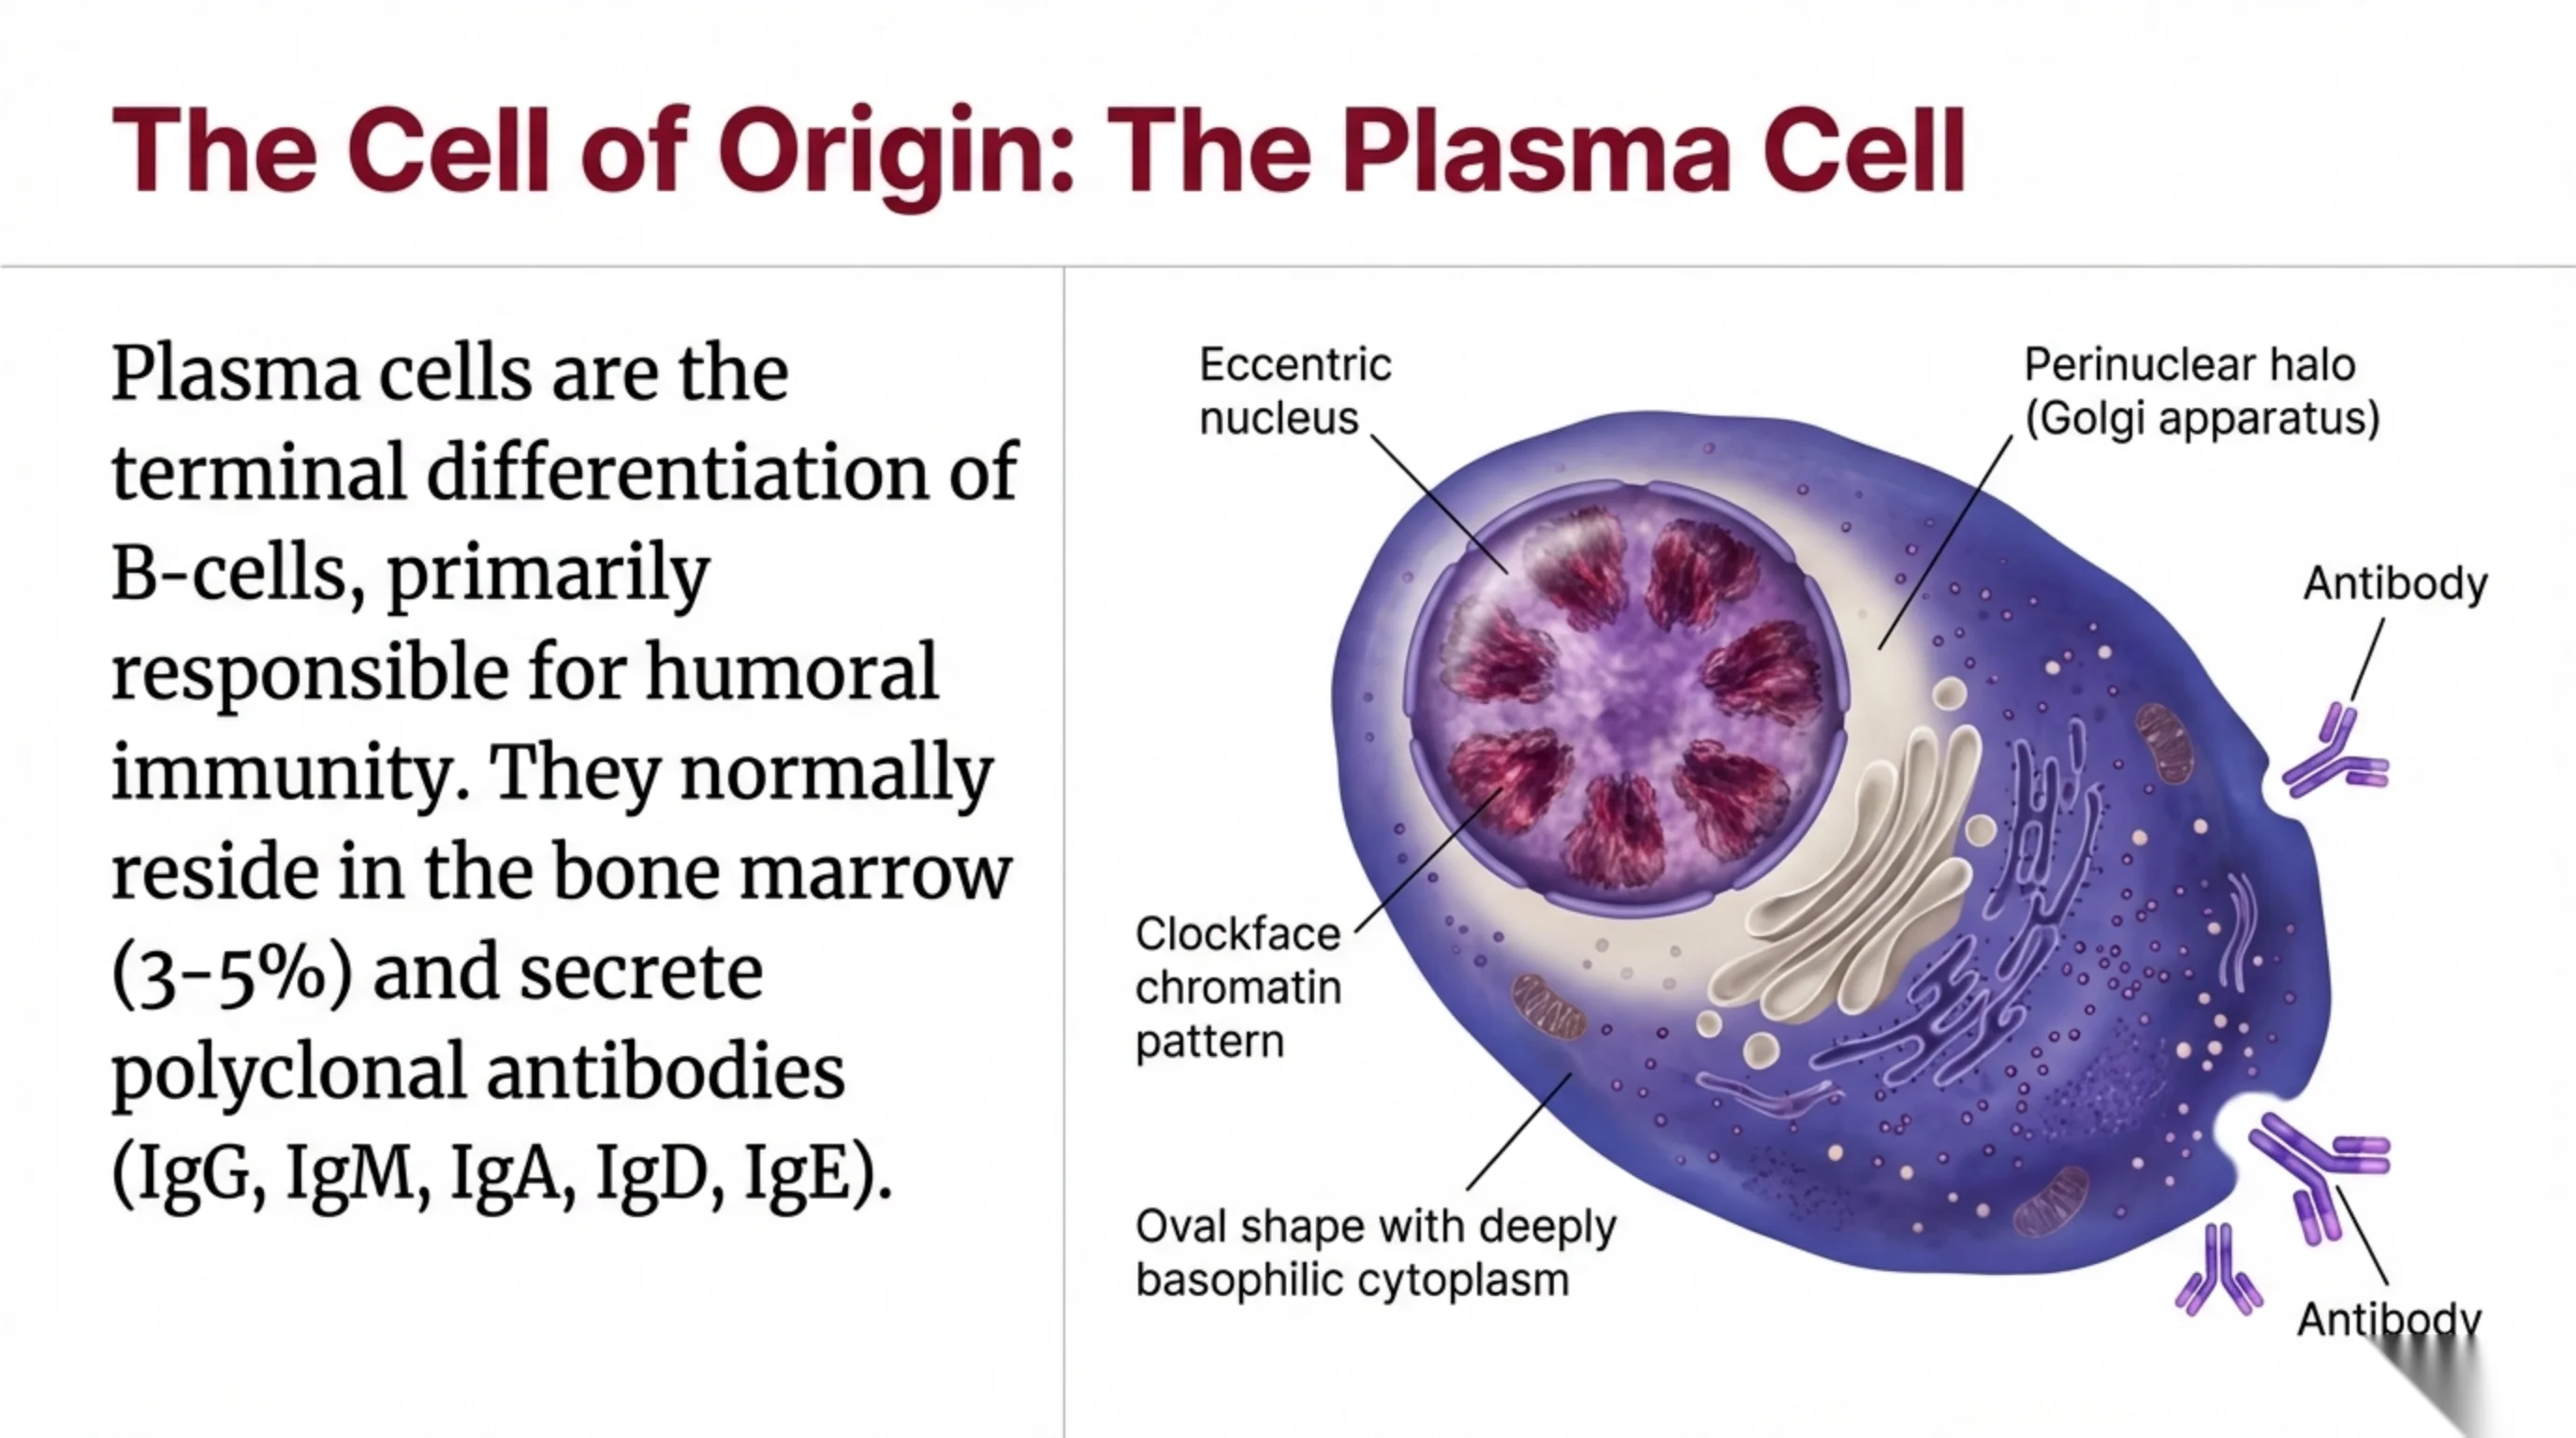
To understand myeloma you need to know the normal plasma cell. It is the final form of the B lymphocyte, the cell a B cell becomes once it has met its antigen and committed itself to producing antibody. Plasma cells live mainly in the bone marrow, where they make up only 3 to 5 percent of the cells, and between them they secrete the whole repertoire of immunoglobulins: IgG, IgM, IgA, IgD and IgE. Because thousands of different plasma cells each make a slightly different antibody, the normal output is polyclonal.
Every feature on the labelled drawing follows from the cell's job, which is to manufacture and export protein. The cytoplasm is deeply basophilic because it is packed with the RNA of rough endoplasmic reticulum. The pale perinuclear halo is the Golgi apparatus, enlarged because it is packaging antibody for secretion. The nucleus is pushed to one side, eccentric, to make room for the machinery, and its chromatin is clumped in the clock-face pattern you saw on the title slide.
Learn this picture. On slide 18 the diagnosis is confirmed by finding too many of these cells in the marrow, and the morphology is how the pathologist recognises them.
See it online.
- Plasma cells with clock-face chromatin ASH Image Bank
The drawing on the previous slide, in a real marrow film
This is a bone marrow film from a patient with myeloma. The colours are unusual for a stained film, but the plasma cells are easy to find: they are the large rounded cells in the lower half of the picture, much bigger than the red cells around them.
Check each feature you learned on the previous slide. The nucleus sits to one side of the cell, not in the middle: it is eccentric. Around it is a wide rim of cytoplasm, because the cell is built to make and export protein. Look for the paler zone in the cytoplasm next to the nucleus, the perinuclear halo where the Golgi apparatus sits; it is easier to see in some cells than in others.
A normal marrow has only 3 to 5 percent plasma cells, so you would not expect to find several lying together like this. On slide 18 the diagnosis depends on how many of them there are.
Image source.
- Plasma cells in a marrow film from a myeloma patient Wikimedia Commons · CC BY-SA 3.0 · Dr Osaro Erhabor
Pathogenesis: one clone, one protein
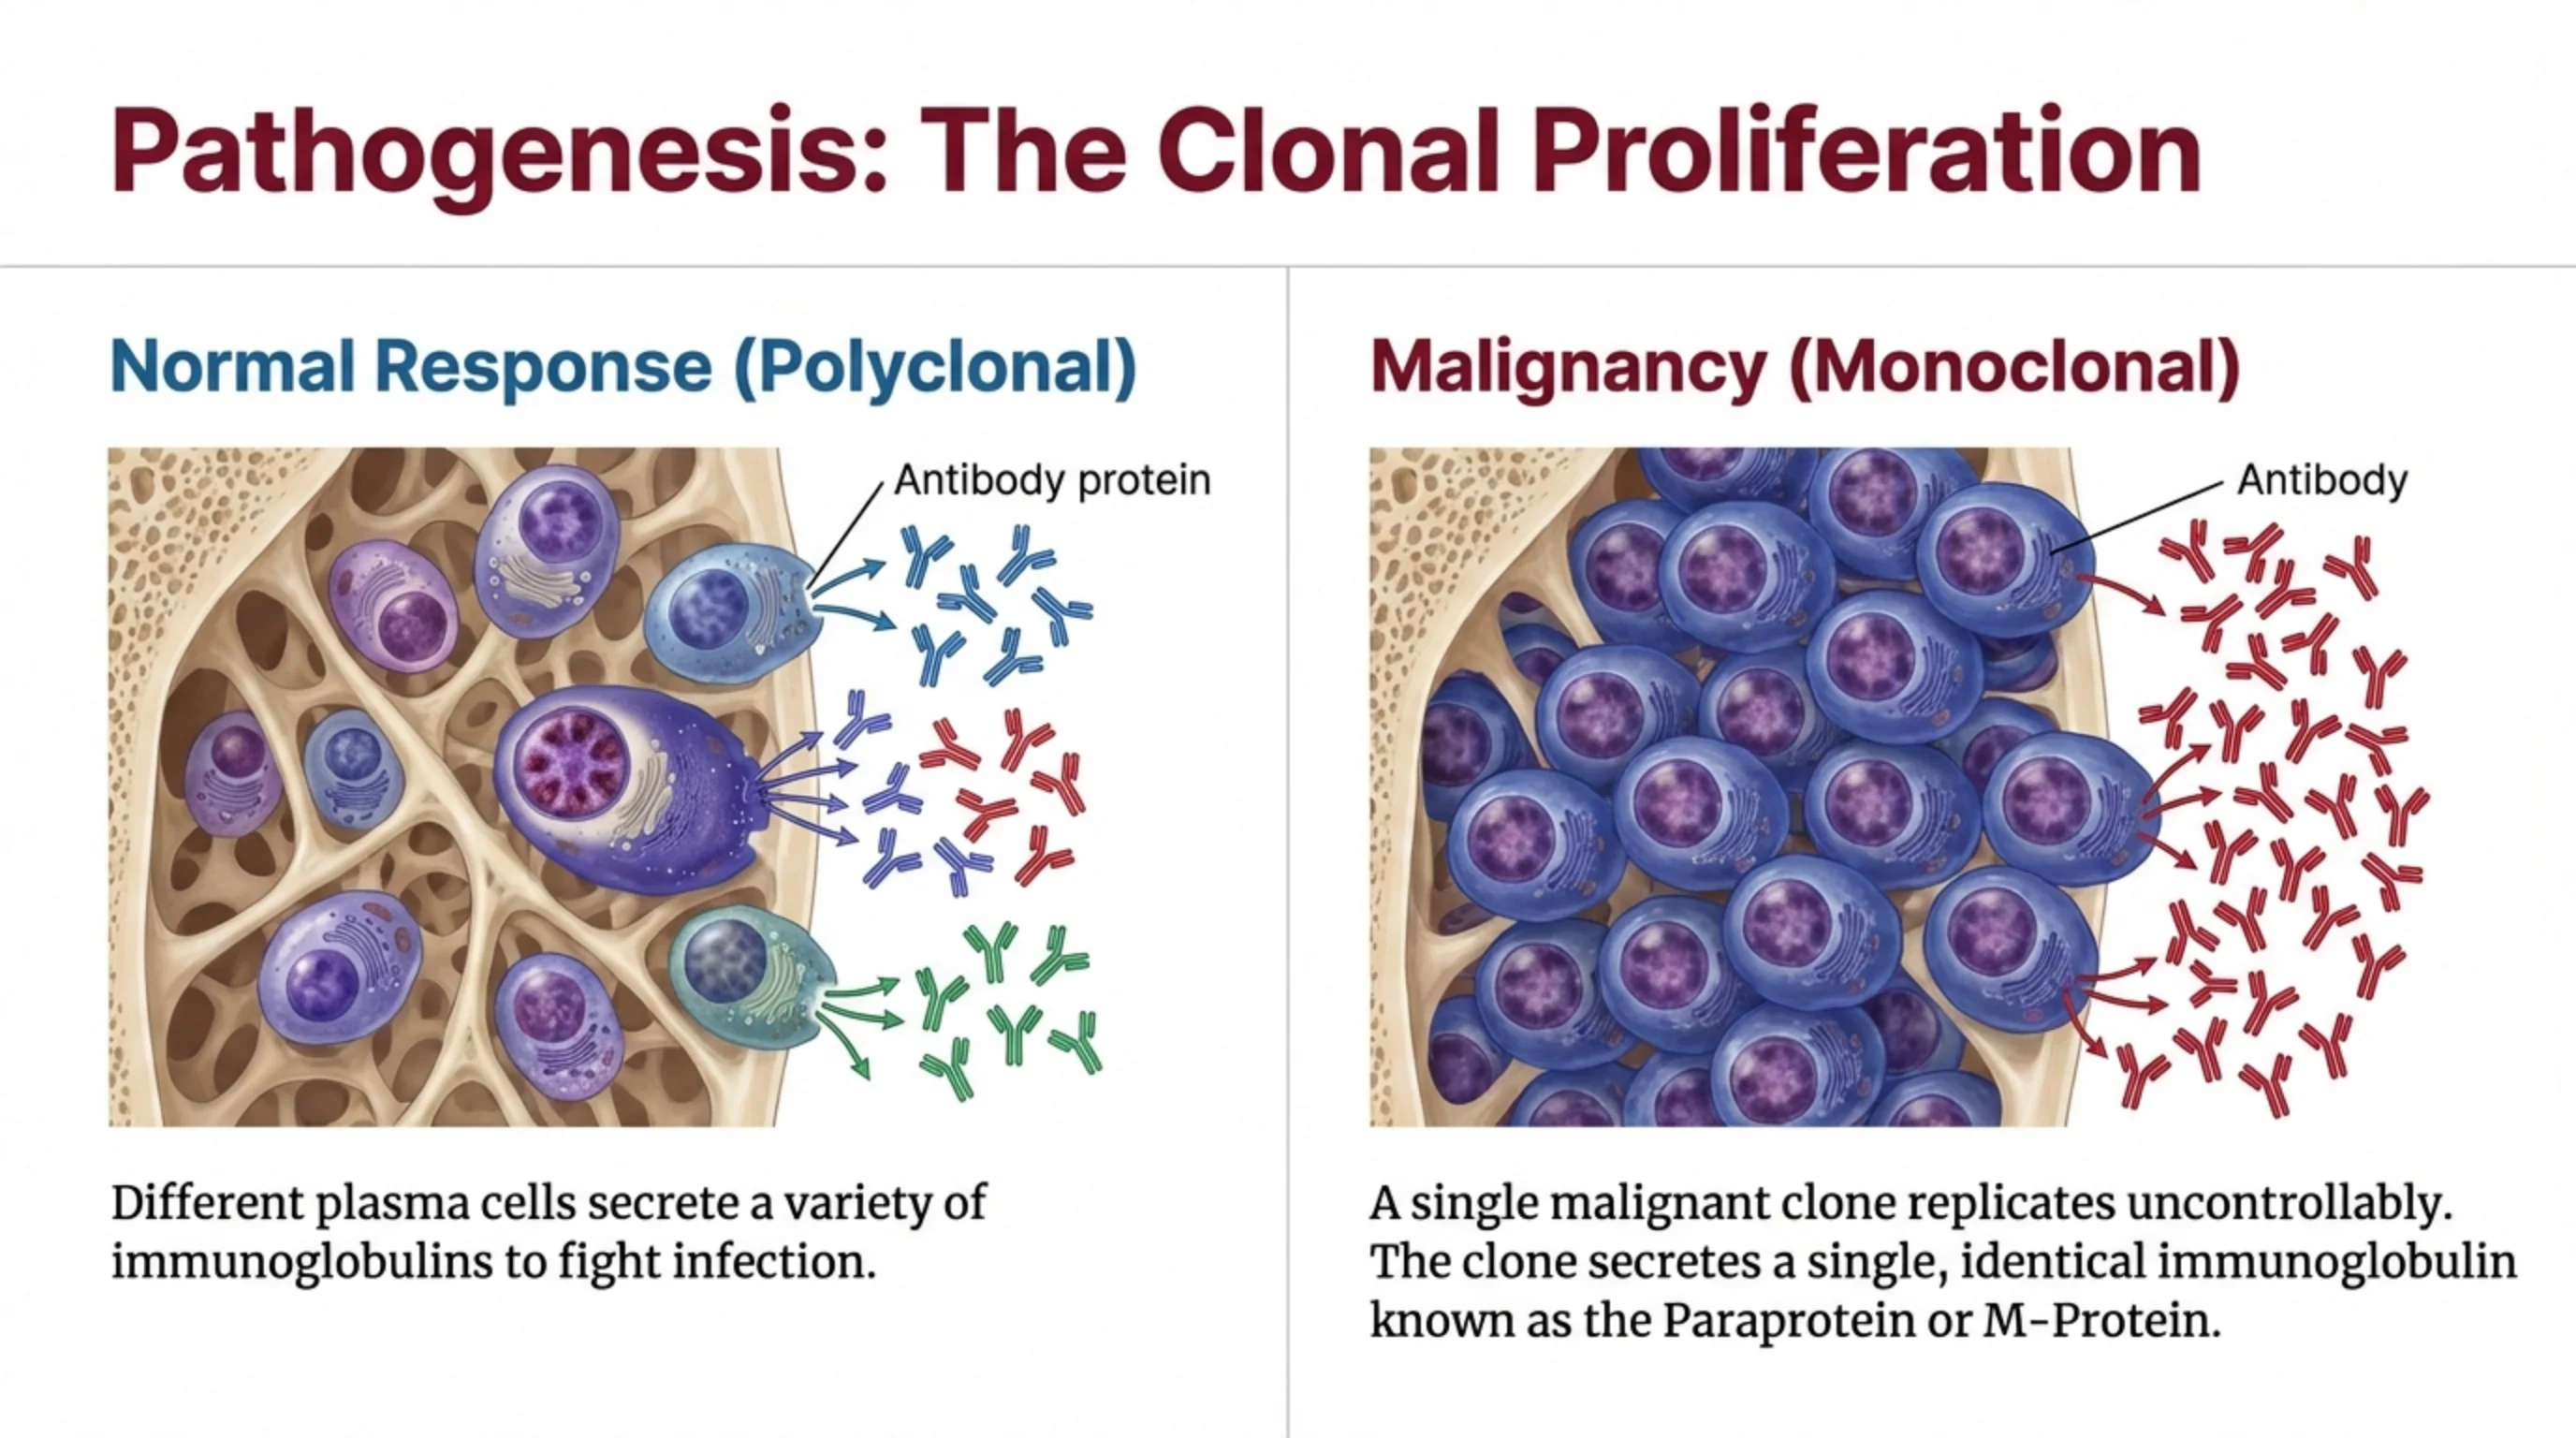
The two panels contrast a healthy marrow with a myeloma marrow, and the difference is not the number of plasma cells so much as their variety. In the normal response many different plasma cells respond to an infection and secrete many different immunoglobulins, drawn on the slide as antibodies of several colours. This diversity is the point of the humoral immune system.
In myeloma a single plasma cell acquires mutations that let it divide without limit. Its descendants are genetically identical, a clone, and because they are identical they all secrete exactly the same immunoglobulin, one colour only. That single protein, present in huge quantity, is called the paraprotein or M-protein (M for monoclonal).
Two consequences follow, and the rest of the lecture is about them. First, the clone occupies the marrow and damages the tissues around it. Second, the M-protein itself circulates in enormous amounts and does harm of its own to the kidneys, the blood and the nerves. In our patient it is the M-protein that raised the total protein to 11 g/dL, and the mass of the clone that will explain his anemia and his bone disease.
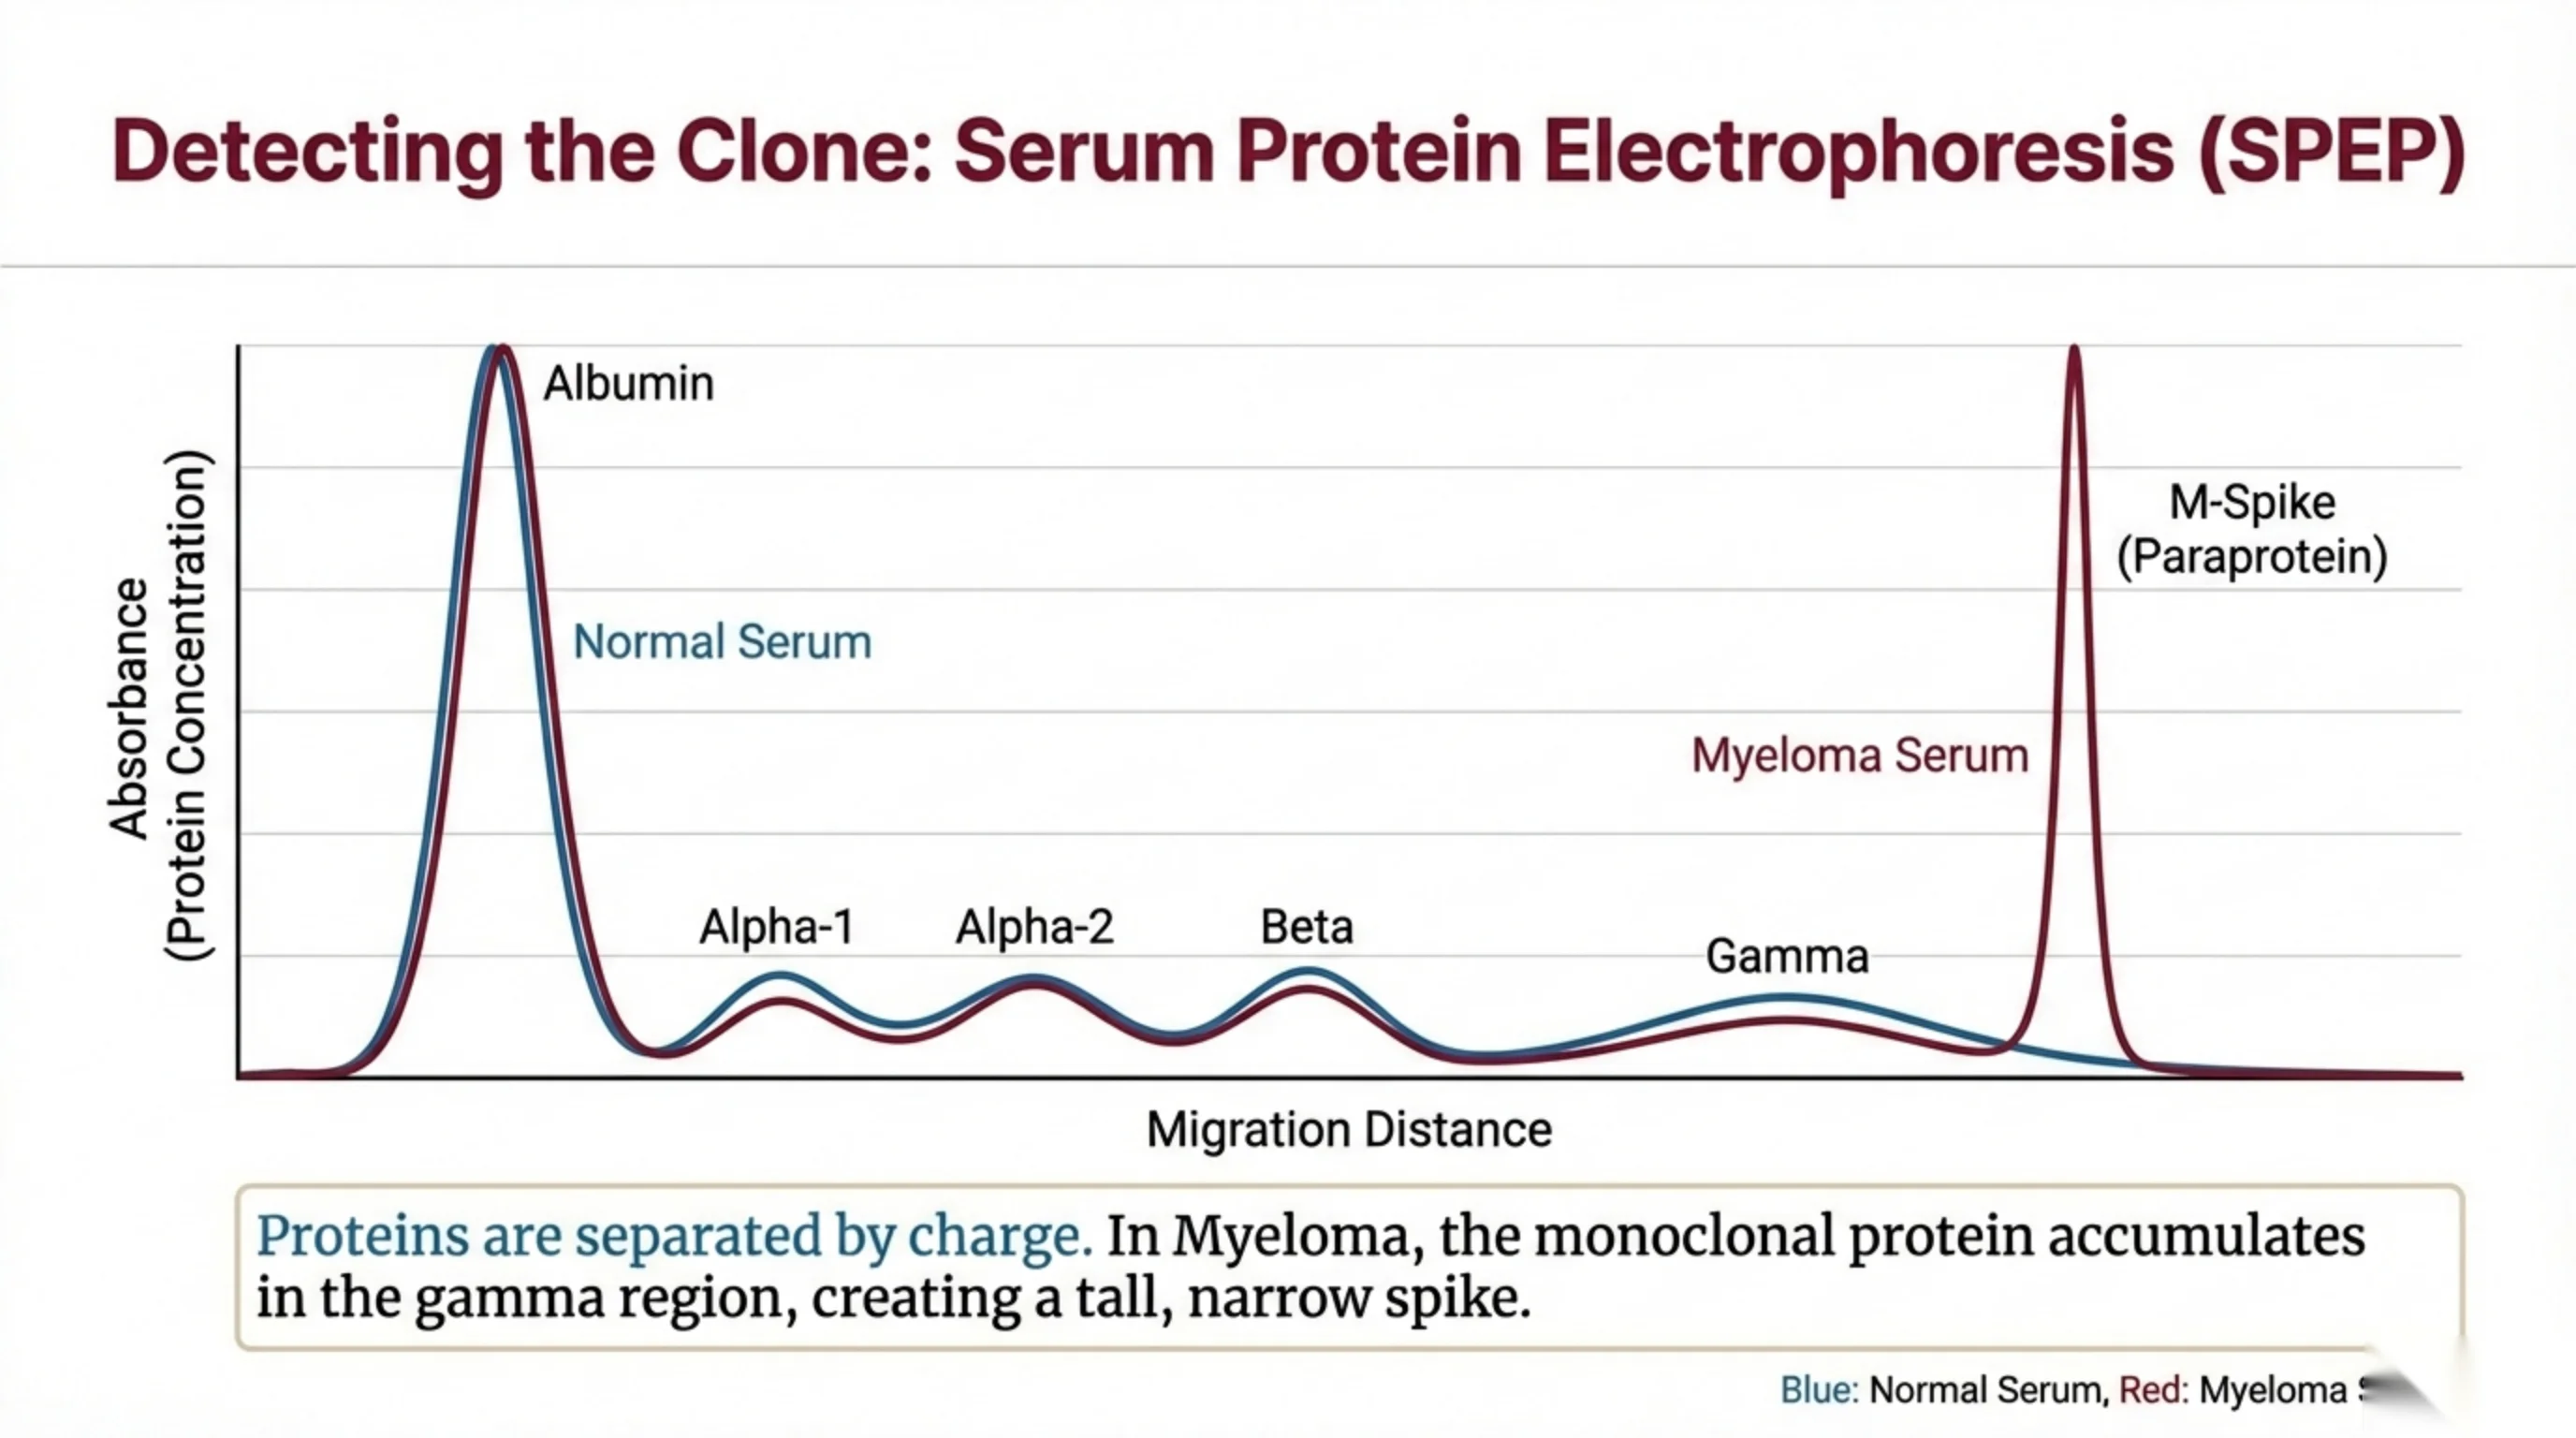
Finding the clone in the blood: serum protein electrophoresis
Serum protein electrophoresis, SPEP, is the test that turned our patient's odd protein gap into a diagnosis. Serum is placed on a gel and an electric current is applied. Proteins move through the gel at speeds determined by their charge, and a scanner then plots how much protein lies at each distance travelled. The horizontal axis of the graph is migration distance; the vertical axis is protein concentration.
Normal serum, the blue tracing, gives five zones in a fixed order: albumin first and tallest, then alpha-1, alpha-2, beta and finally gamma. The gamma region is where the immunoglobulins run, and in health it is a low, broad hump. It is broad because it contains thousands of different antibodies, each with a slightly different charge, spread across a range of positions.
Myeloma serum, the red tracing, shows the change that matters: a tall, narrow spike in the gamma region. It is tall because there is a great deal of protein, and it is narrow because every molecule of that protein is identical and therefore migrates to exactly the same spot. That narrowness is the signature of a monoclonal protein. A broad rise in the gamma region means many antibodies and suggests chronic infection or inflammation; a sharp spike means one antibody and suggests a clone.
The two tracings, side by side
These two tracings show the pattern described on the previous slide, one beside the other. Read each from left to right, in the order the proteins travel: albumin first, then alpha-1, alpha-2, the beta region (drawn here as two peaks, beta-1 and beta-2), and gamma last.
On the left is normal serum. The gamma region is a low, broad hump, because it holds thousands of different antibodies, each migrating to a slightly different spot.
On the right the gamma region has become a tall, narrow spike. That is the M-spike: one antibody in a large amount, every molecule migrating to the same place. Notice where it sits: it rises out of the gamma region itself, where the immunoglobulins run.
Image source.
- Serum protein electrophoresis, normal and with a paraprotein Wikimedia Commons · CC BY-SA 4.0 · Furfur, after Simon Caulton

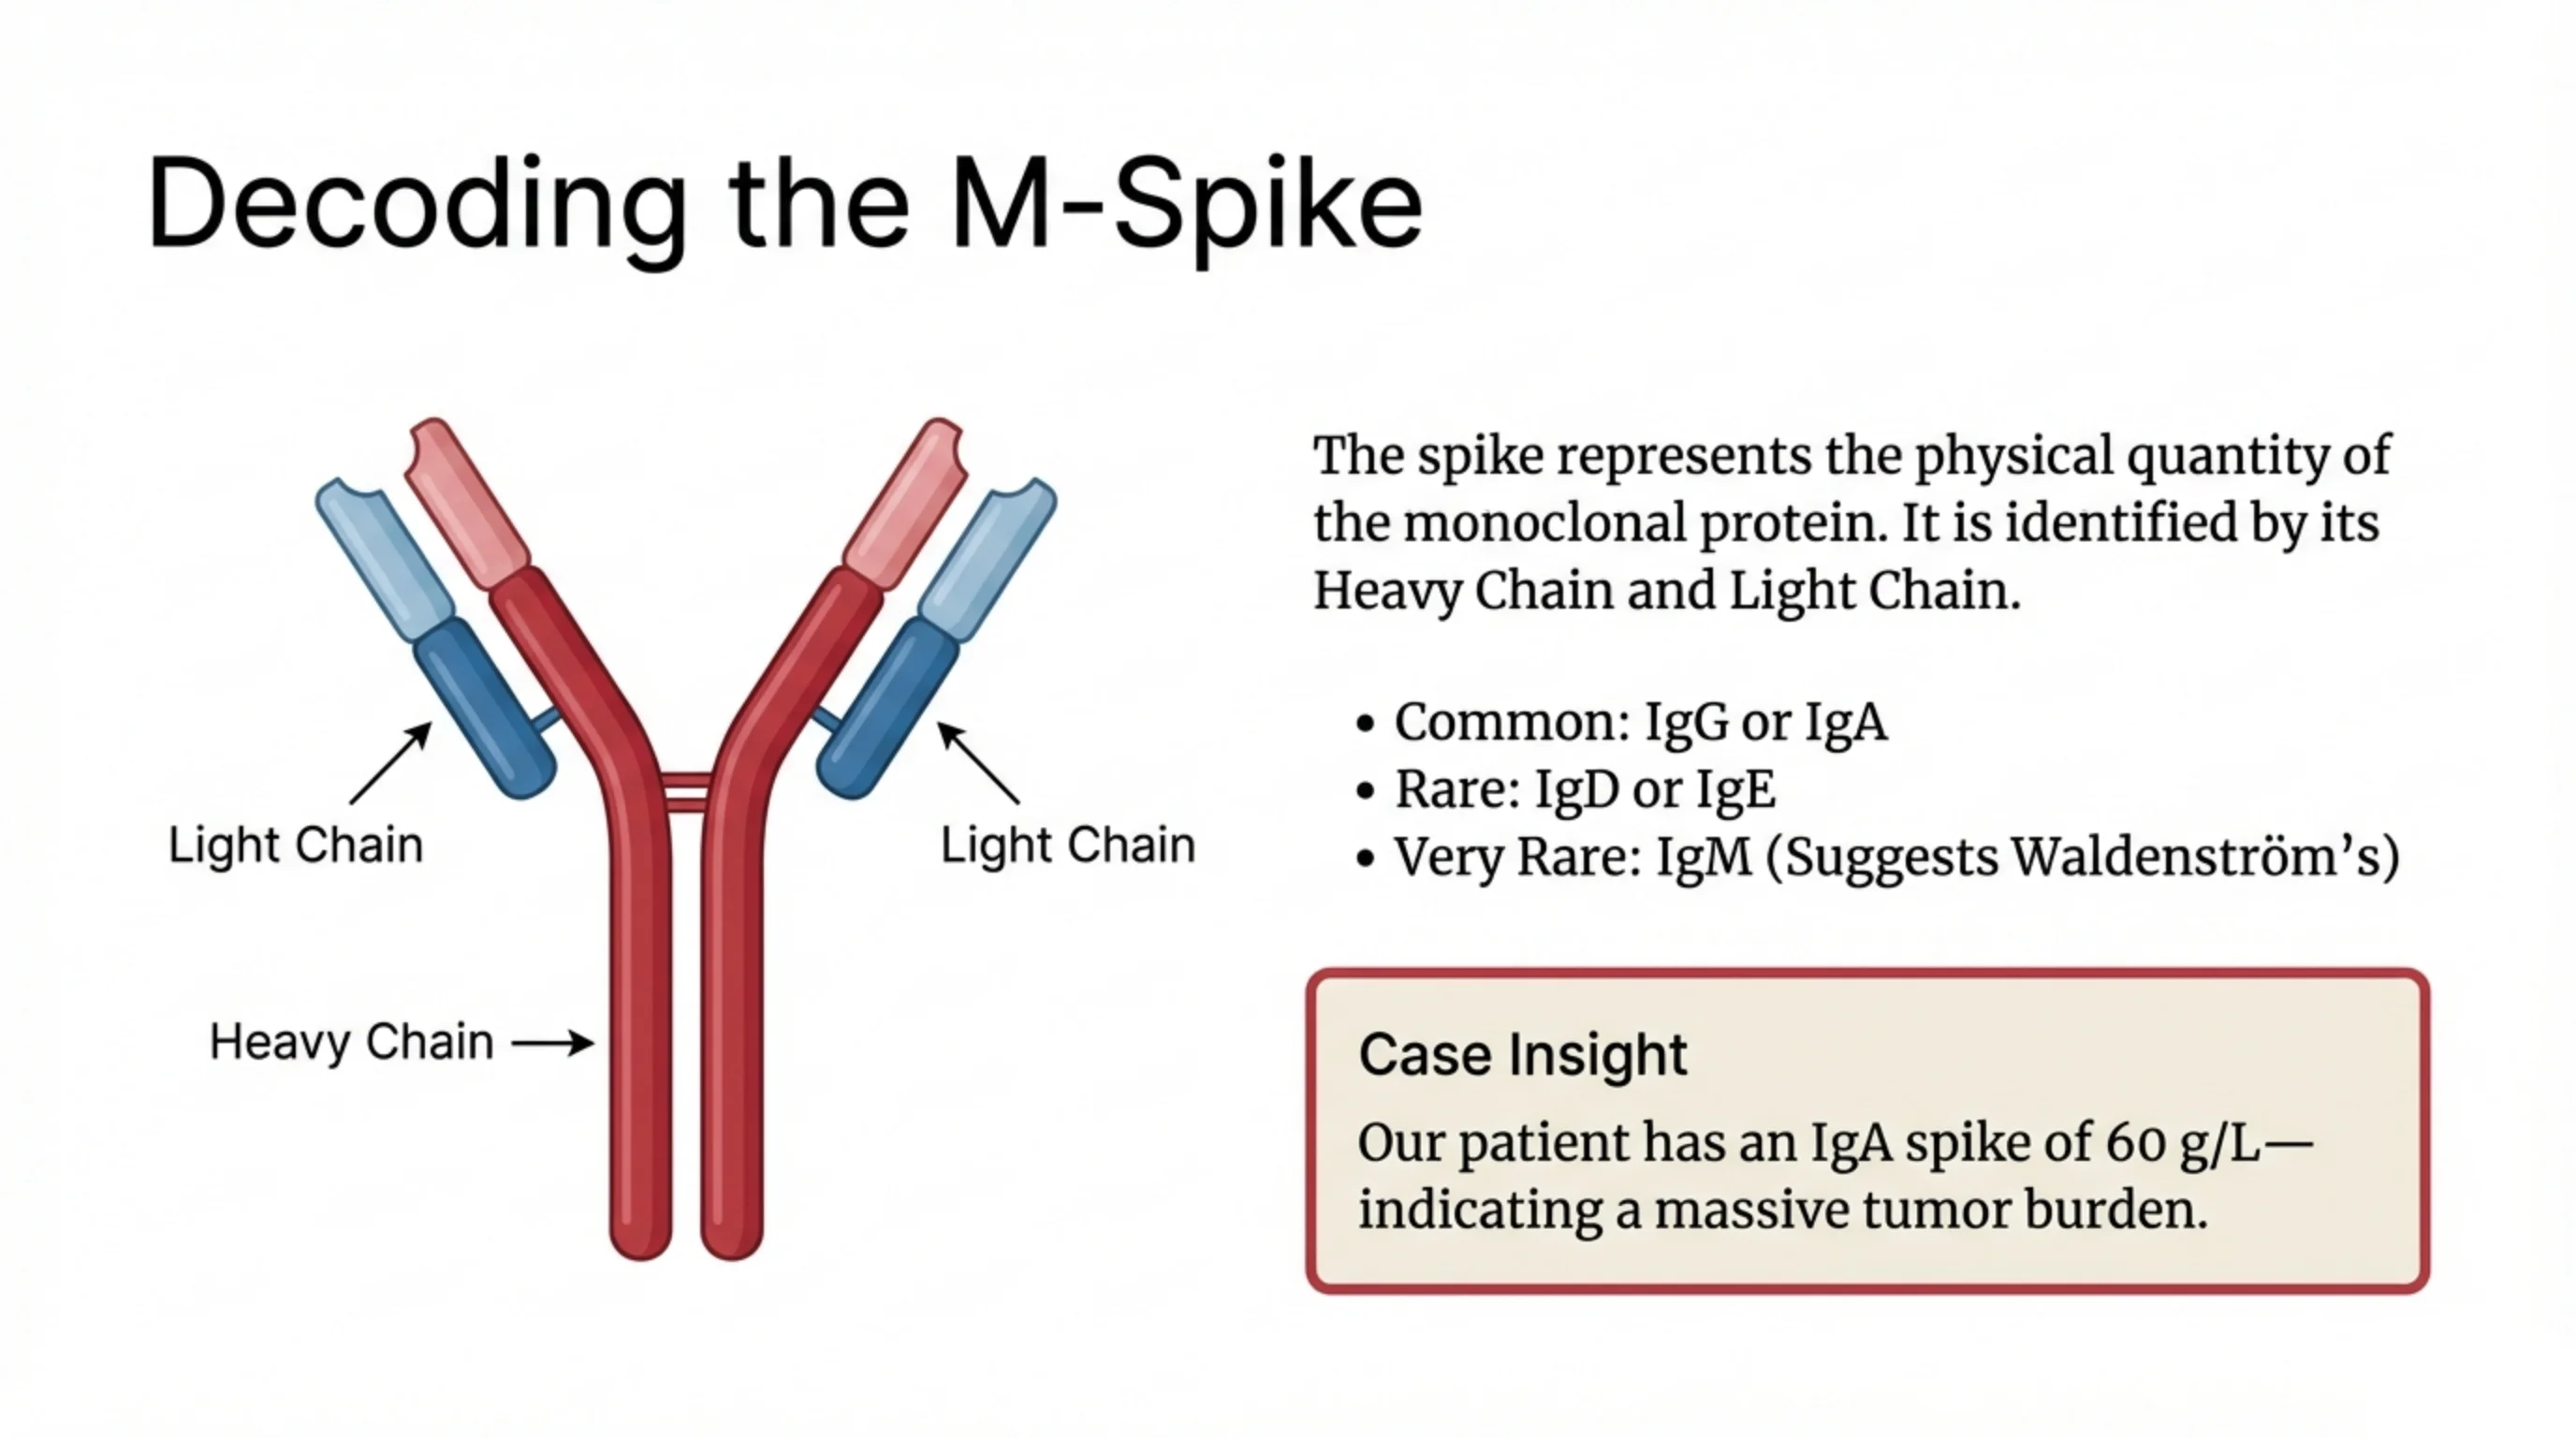
Decoding the M-spike: how much, and which antibody
The spike on the electrophoresis tracing answers two questions. Its height, or more precisely the area under it, measures the physical quantity of the monoclonal protein and so tracks the size of the tumour. Its identity is established by working out which heavy chain and which light chain the antibody is built from, using the Y-shaped structure drawn on the slide: two heavy chains forming the stem and inner arms, two light chains along the outer arms.
The heavy chain names the class. IgG and IgA myeloma are common. IgD and IgE are rare. An IgM paraprotein is very rare in myeloma and should make you think instead of Waldenström's macroglobulinemia, the differential diagnosis on slide 17.
Our patient has an IgA spike measuring 6 g/dL. Set that against the whole normal immunoglobulin pool and it represents a massive tumour burden: a single clone producing more antibody than all his normal plasma cells combined, at the expense of everything else the marrow should be making.

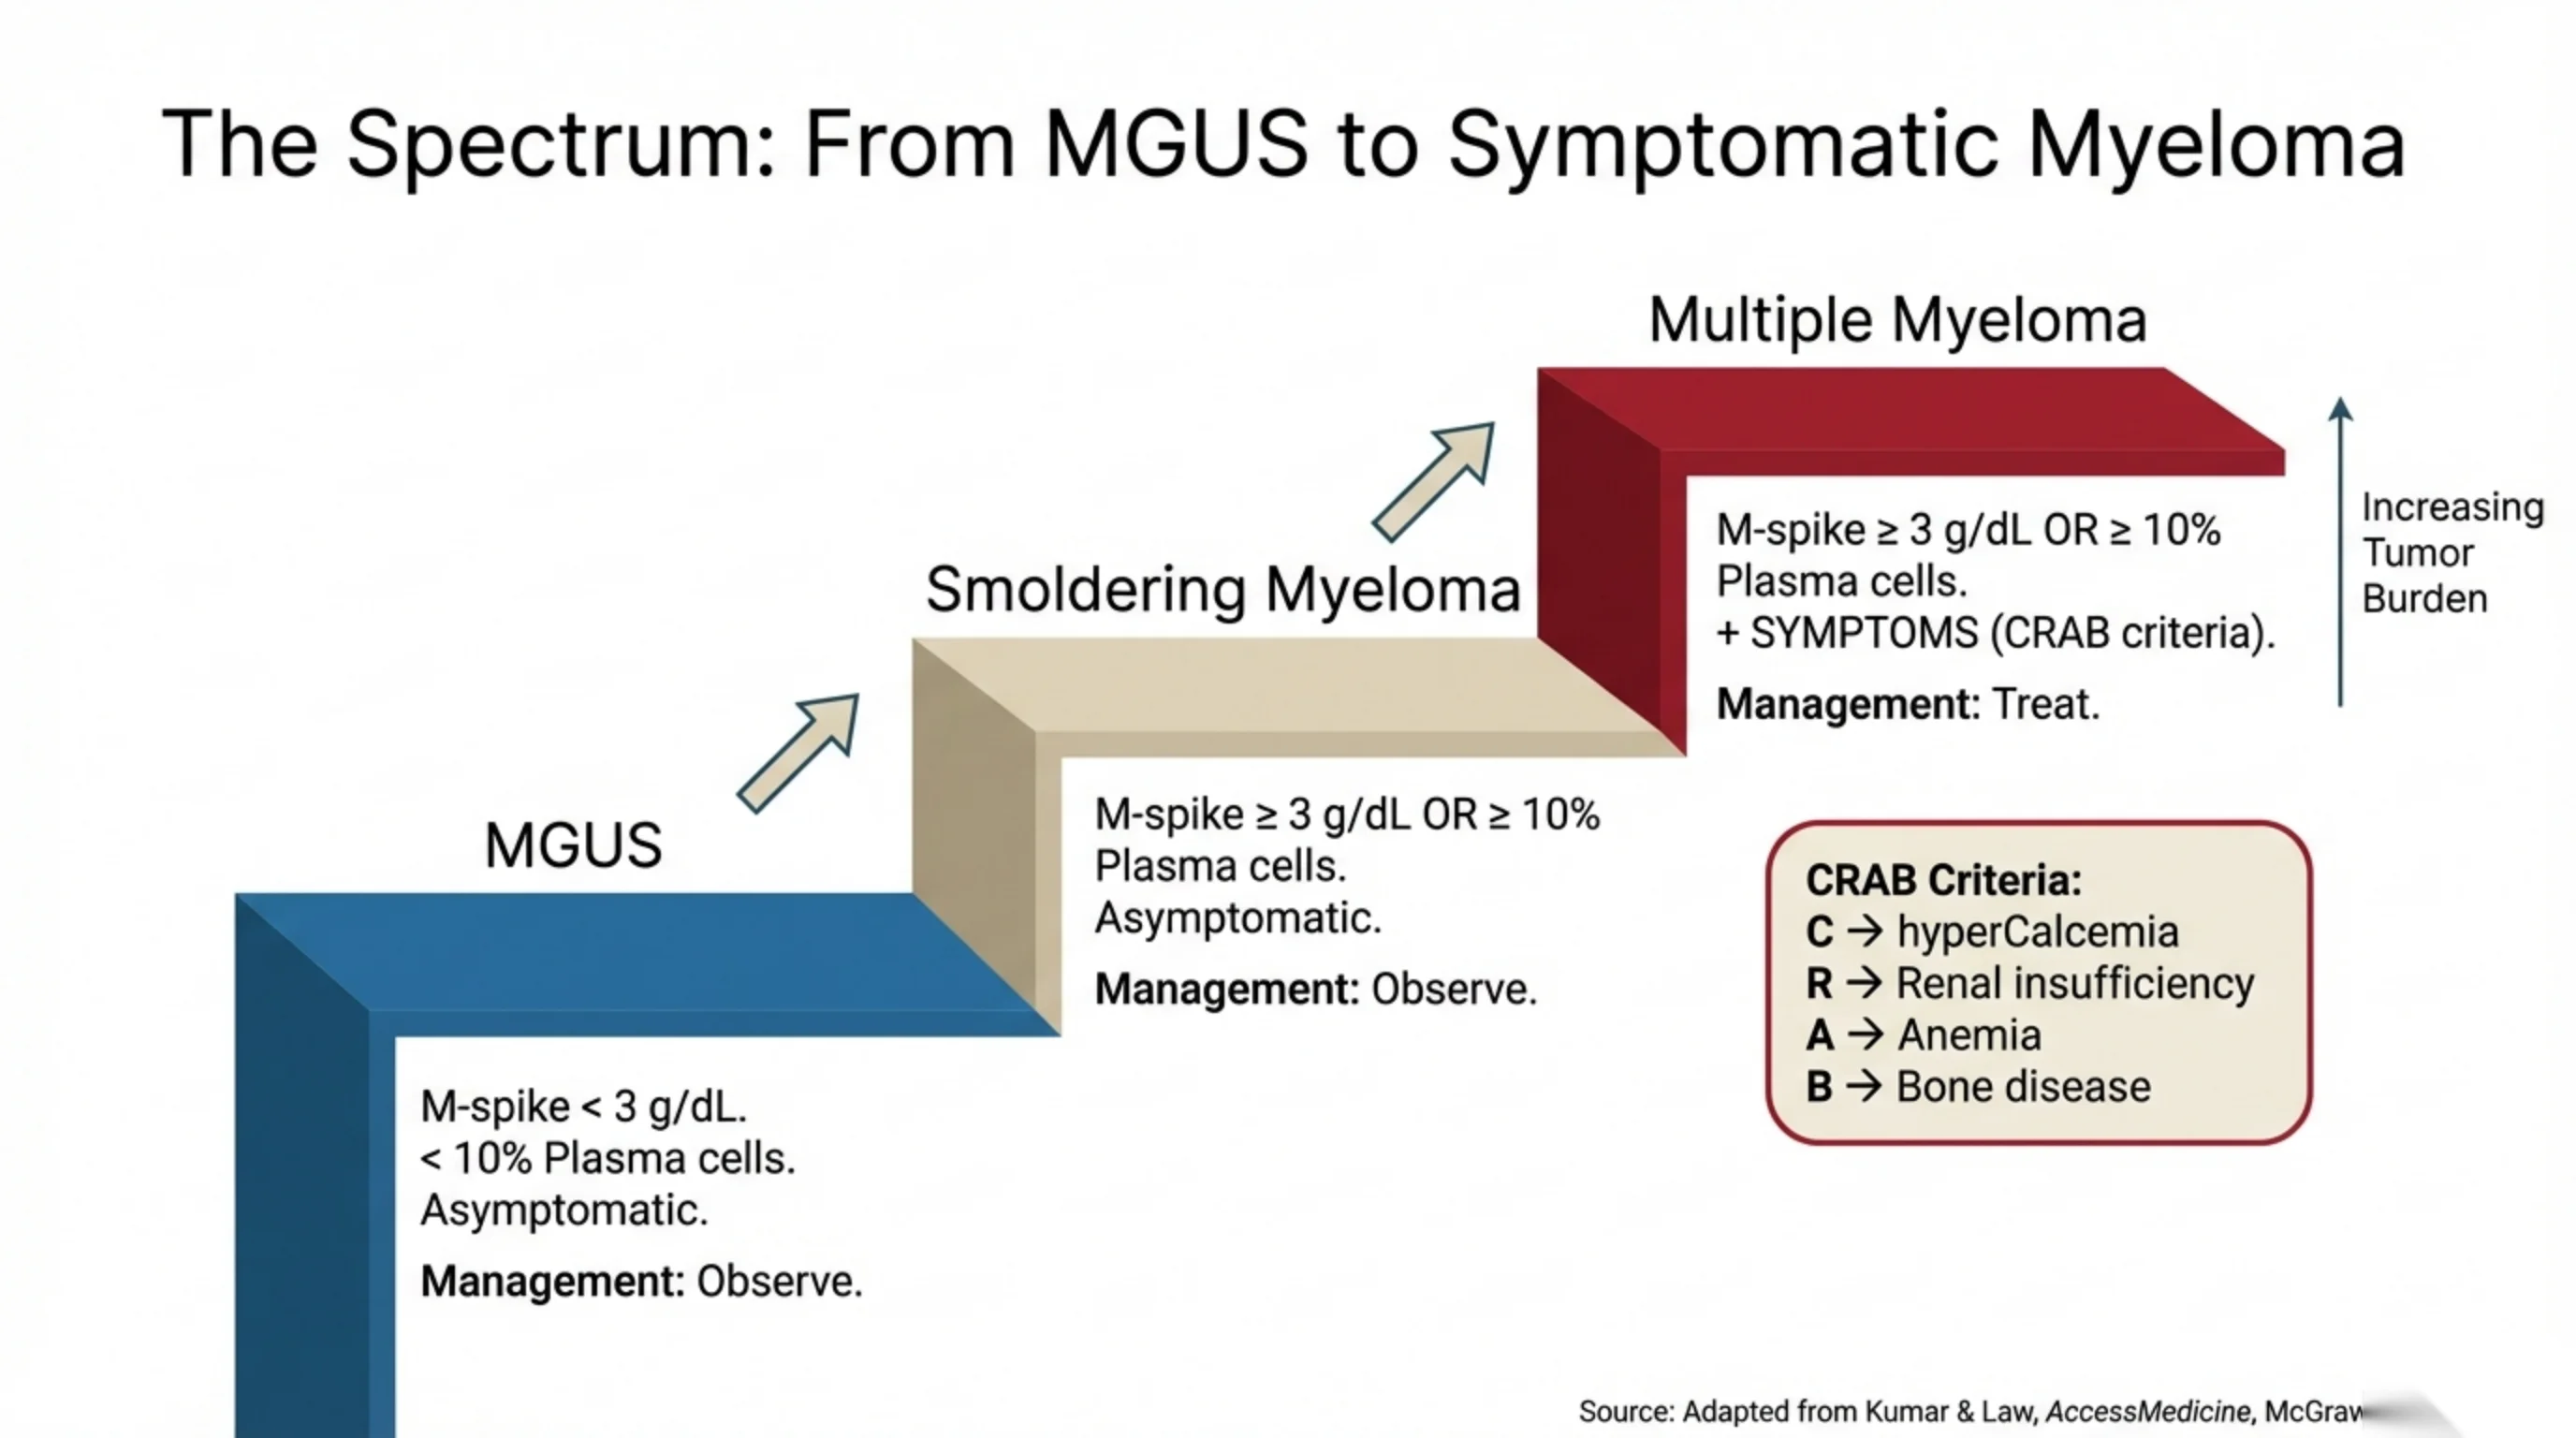
The spectrum: from a harmless paraprotein to disease that must be treated
Not every monoclonal protein is myeloma. The staircase on the slide shows three conditions arranged by increasing tumour burden, and the boundaries between them are defined by three measurements: the size of the M-spike, the percentage of plasma cells in the bone marrow, and whether the patient has symptoms.
MGUS, monoclonal gammopathy of undetermined significance, is the bottom step: an M-spike below 3 g/dL, fewer than 10 percent plasma cells in the marrow, and no symptoms. It is managed by observation. Smoldering myeloma is the middle step: the M-spike has reached 3 g/dL or more, or plasma cells have reached 10 percent or more, but the patient still has no symptoms. It too is observed. Multiple myeloma is the top step: the same laboratory thresholds, but now with symptoms, defined as the CRAB criteria in the key box. Only at this step does management change from observing to treating.
The lesson is that the decision to treat does not turn on how much paraprotein there is but on whether the clone has started to damage organs. The CRAB criteria are what separate the last two steps: hyperCalcemia, Renal insufficiency, Anemia and Bone disease. The next slide takes them one at a time.

CRAB: the four ways the clone damages the body
Symptomatic myeloma is defined not by the size of the tumour but by end-organ damage, and the damage falls into four categories that the acronym CRAB keeps together. C is hyperCalcemia. R is Renal insufficiency. A is Anemia. B is Bone disease. If a patient with a monoclonal protein has any one of these, and the paraprotein is the cause, the disease has crossed the line into myeloma and needs treatment.
Go back to the case on slide 2 and you will find three of the four already present in the first set of results: calcium 11.2 mg/dL, creatinine 1.8 mg/dL, hemoglobin 10.6 g/dL. The fourth, bone disease, needs imaging to look for, and slide 11 shows what you would expect to find.
The four are linked mechanically, which is why they travel together. Bone destruction releases calcium; calcium and light chains injure the kidney; kidney failure and marrow infiltration deepen the anemia. The next four slides work through each in turn.
B for bone: why myeloma punches holes in the skeleton
Bone is remodelled continuously by two cell types in balance: osteoclasts, which resorb bone, and osteoblasts, which lay it down. Myeloma cells upset the balance from both sides at once. They stimulate osteoclasts, so bone is eaten faster, and they suppress osteoblasts, so it is not rebuilt. The result is net loss of bone wherever the clone is active.
The consequences are listed on the slide in order of severity. Diffuse osteopenia thins the whole skeleton. Focal collections of myeloma cells produce lytic lesions, and because the osteoblasts that would normally wall off a lesion are switched off, these holes have no sclerotic rim. On a radiograph they look as if they had been punched out with a tool, and the lateral skull X-ray on the slide shows dozens of them. Weakened bone gives way under ordinary loads, producing pathological fractures, often of the vertebrae. Finally, the calcium released from destroyed bone enters the blood: this is the C of CRAB, and it is the mechanism of our patient's calcium of 11.2 mg/dL.
Bone pain, typically in the back or ribs and worse with movement, is one of the commonest presenting complaints of myeloma. In an older patient with back pain and anemia, think of this slide.
See it online.
- Lytic lesions on skull and pelvic radiographs in myeloma ASH Image Bank

Punched-out lesions on real films
The previous slide explained why myeloma makes holes in bone: the osteoclasts are driven harder and the osteoblasts are switched off, so bone is removed and not rebuilt. These two films show the result.
On the left is a lateral skull film. Look across the vault for many small, rounded dark areas. Each is a place where bone has been removed. They are subtle on this film, and that is a lesson in itself: a lytic lesion is easy to miss unless you look for it.
On the right the same process is in the shoulder. The humerus, the scapula and the ribs all carry lytic lesions. Lesions form wherever the clone is active, so they are not confined to the skull.
Look at the edges of the holes. As the previous slide explained, the osteoblasts that would normally wall off a lesion are switched off, so the holes have no bright, sclerotic rim.
Image source.
- Skull radiograph with multiple lucencies in myeloma Wikimedia Commons · CC BY-SA 4.0 · James Heilman, MD
- Multiple lytic lesions in the humerus, scapula and ribs Wikimedia Commons · CC BY-SA 4.0 · Chaustanley
R for renal: the light chains that block the tubules
The kidney is injured in myeloma by several routes, but the slide singles out the most important: cast nephropathy. The clone produces not only complete antibody but an excess of free light chains, small enough to pass through the glomerular filter into the tubular fluid. Filtered light chains are also called Bence Jones proteins. In the distal tubule they meet Tamm-Horsfall protein, which is normally secreted there, and the two bind to form insoluble casts. The casts plug the tubules and the nephrons behind them stop working. The magnified inset on the nephron diagram shows exactly this: an obstructing cast lodged in a tubule.
Notice where on the nephron the injury sits. It is a tubular obstruction, not a glomerular disease, which is why the protein in the urine is light chain rather than albumin and why an ordinary dipstick, which detects albumin, can be negative.
Three contributing factors make the injury worse, and two of them are within your control. Hypercalcemia and hyperviscosity both reduce renal perfusion and promote cast formation; and NSAIDs, which a patient with bone pain is very likely to be taking, constrict the afferent arteriole and can tip a struggling kidney into failure. A practical rule follows: a patient with suspected myeloma should not be given NSAIDs. Our patient's creatinine of 1.8 mg/dL is the R of CRAB, and cast nephropathy is its most likely cause.
Read next. In the Interpretation chapter of the casebook, Urinalysis, Done Properly (Chapter 8) makes the dipstick point from this slide part of reading any urine result: the dipstick does not detect Bence Jones protein, so a negative dipstick does not exclude light chains in the urine.
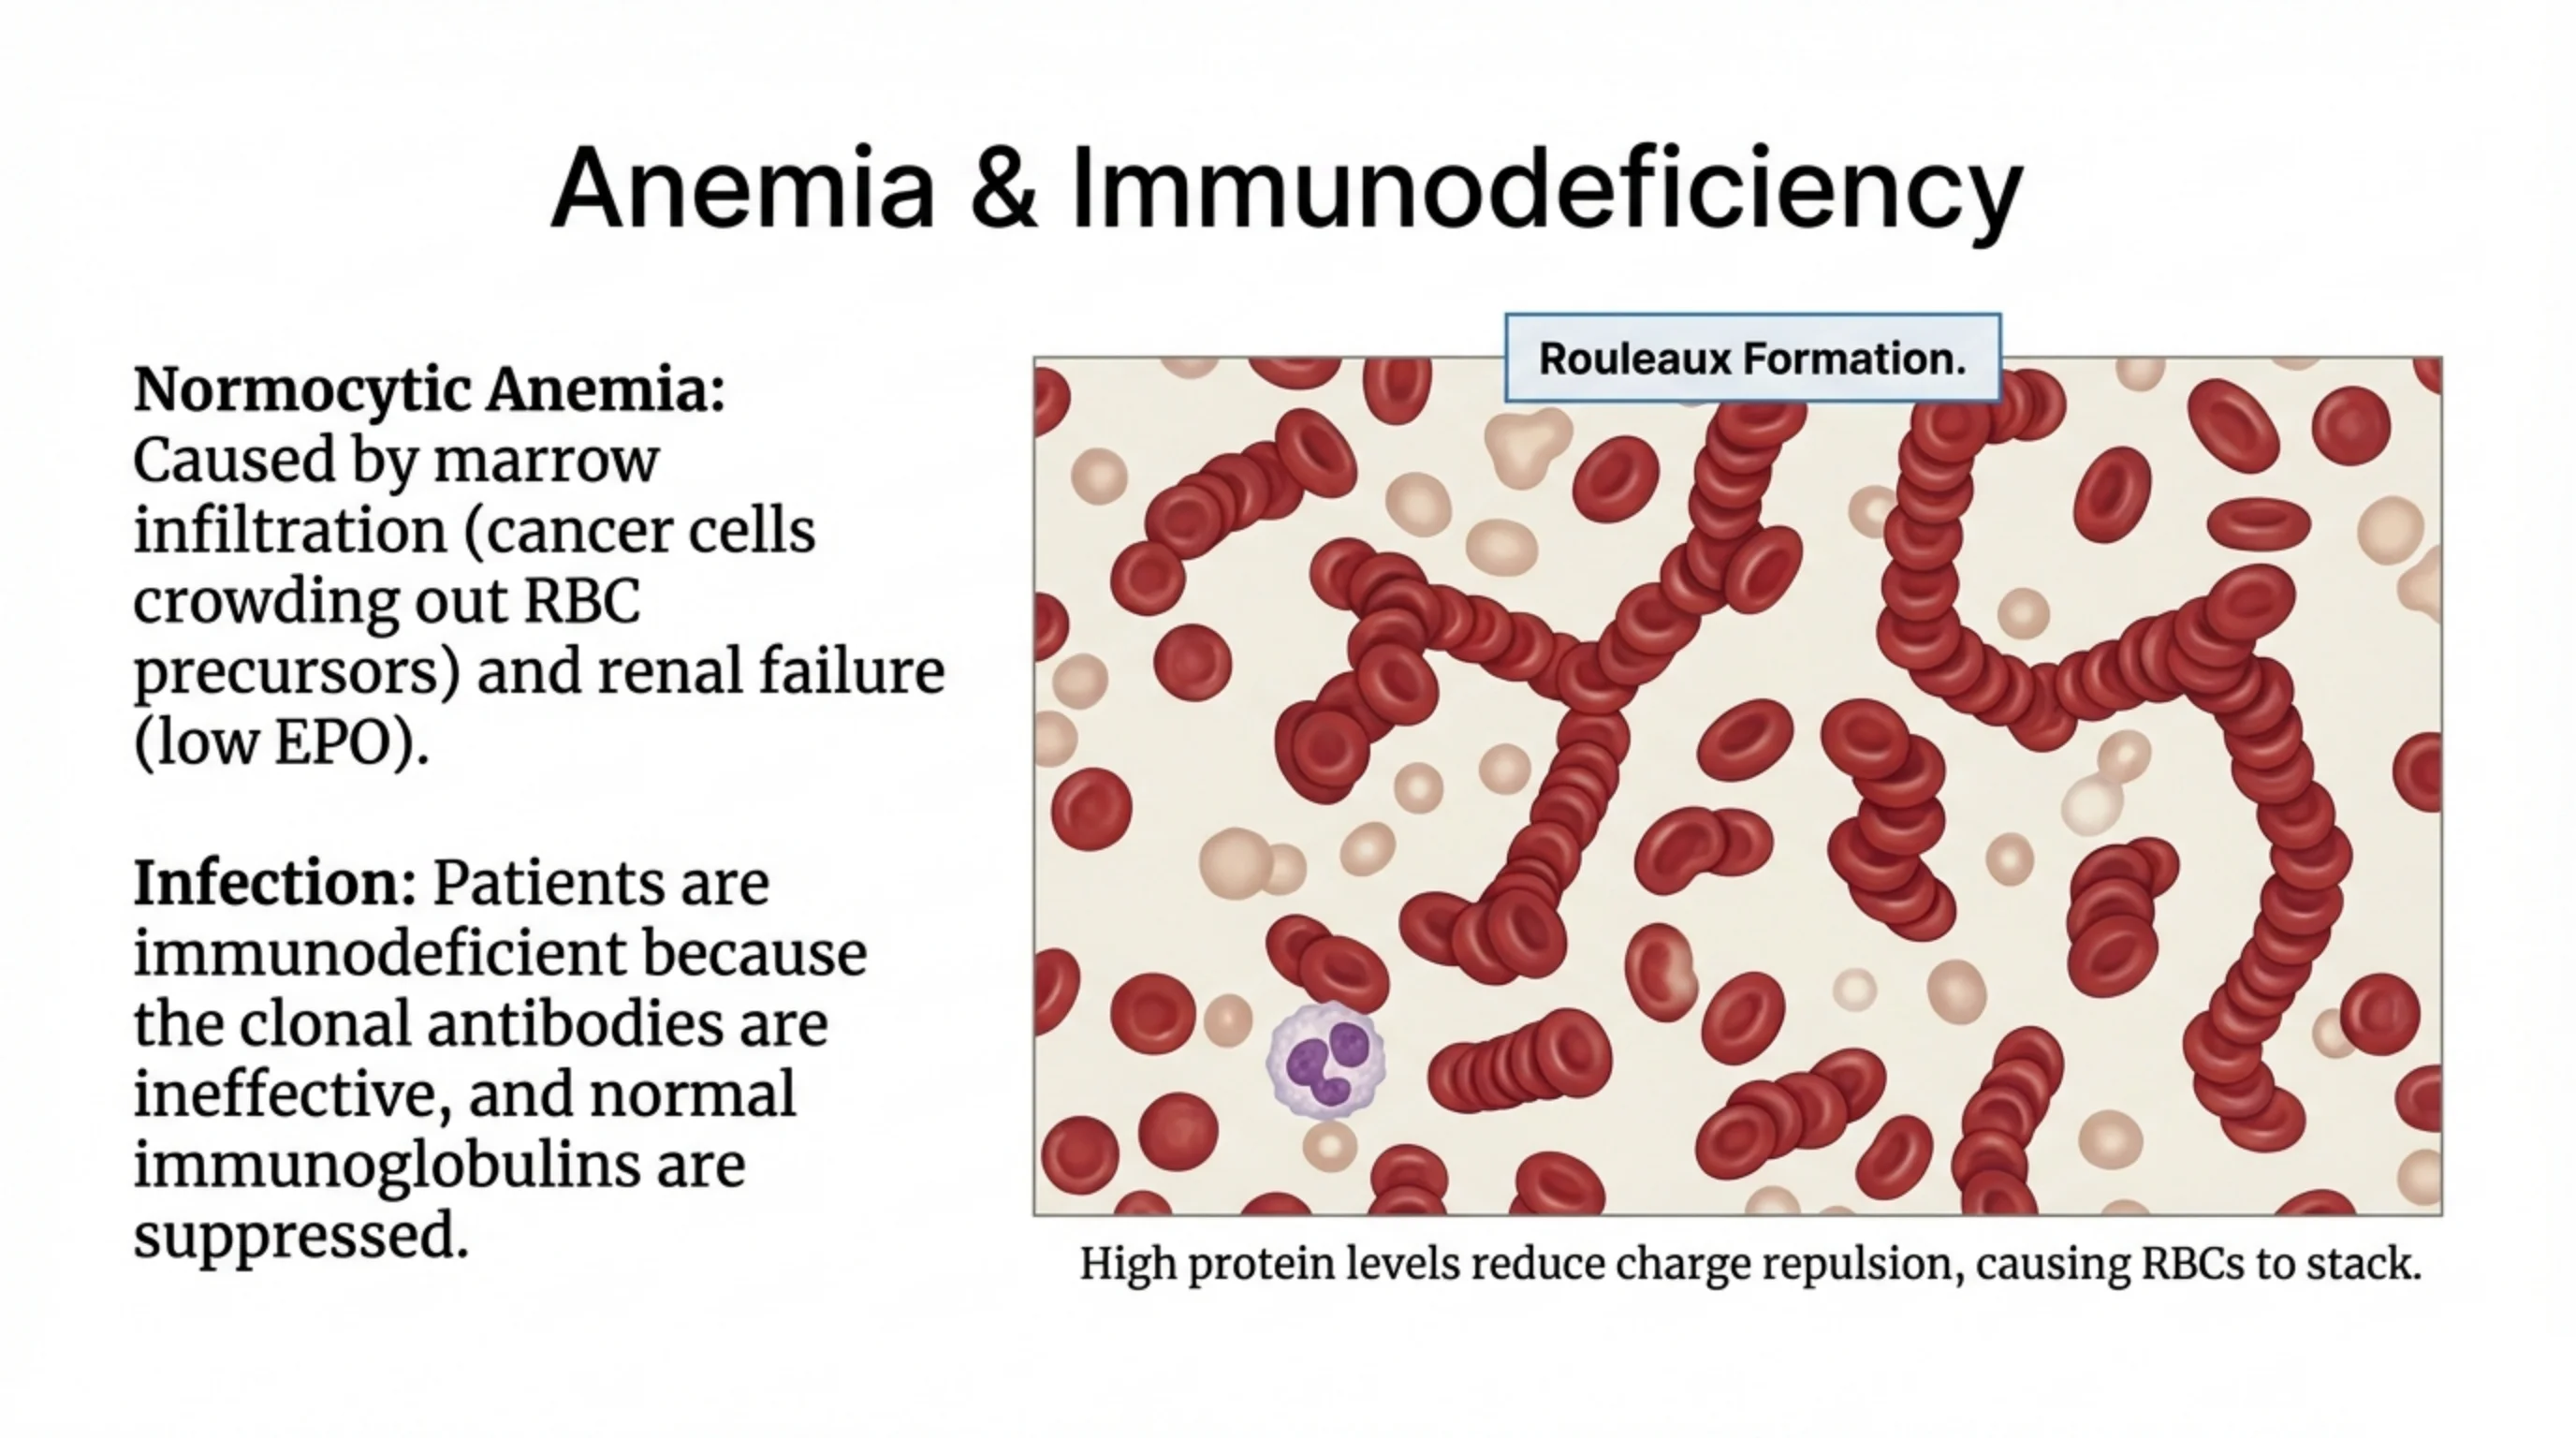
A for anemia, and the paradox of an immune system that cannot fight
The anemia of myeloma is normocytic, and it has two causes that add together. The clone physically occupies the marrow and crowds out the red cell precursors, so fewer red cells are made. At the same time the damaged kidneys produce less erythropoietin, so the marrow that remains is under-stimulated. Our patient's hemoglobin of 10.6 g/dL, the A of CRAB, comes from both.
The immune paradox is worth pausing on. Here is a patient whose blood contains more antibody than almost anyone's, yet he is immunodeficient. The reason is that the monoclonal antibody is useless: it is one antibody, directed at nothing in particular, and it cannot recognise the bacteria he meets. Meanwhile the normal plasma cells have been crowded out, so the polyclonal immunoglobulins that would protect him are suppressed. Recurrent infections, especially of the chest and urinary tract, are a common presentation and a leading cause of death in myeloma.
The smear on the slide shows rouleaux: red cells stacked in columns like coins. Red cells normally repel each other because their surfaces carry a negative charge. A high concentration of plasma protein neutralises that repulsion and lets them stick face to face. Rouleaux on a blood film, or an unexpectedly high erythrocyte sedimentation rate which has the same cause, is a clue that should send you to the protein electrophoresis.
Read next. In the Interpretation chapter of the casebook, The Inflammatory Markers (Chapter 11) takes the sedimentation-rate clue on this slide one step further. A paraprotein pushes the sedimentation rate up, so a very high sedimentation rate with a normal C-reactive protein should prompt a myeloma screen.
See it online.
- Rouleaux on a blood film in myeloma ASH Image Bank

What rouleaux look like
This is a nineteenth-century photograph taken through a microscope, a daguerreotype. It is not from a patient with myeloma, and nothing is recorded about whose blood it was. It is here because it shows the finding on the previous slide very clearly.
Most of the red cells are not lying flat and separate. They are stacked face to face in long columns, like a pile of coins seen from the side. That is what rouleaux means. The drawing on the previous slide shows the same stacks on a modern stained film.
The previous slide also explained why it happens. Red cells normally repel each other because their surfaces carry a negative charge. A high concentration of plasma protein cancels that repulsion and lets them stick together. In a patient, rouleaux on a blood film, or an unexpectedly high sedimentation rate, should send you to the protein electrophoresis.
Image source.
- Rouleaux of blood corpuscles (Wellcome Collection) Wikimedia Commons · CC BY 4.0 · Alfred Donné and Léon Foucault

Neurological complications: one emergency and one chronic problem
Myeloma reaches the nervous system by two quite different routes, and the two halves of the slide separate them.
Spinal cord compression is the emergency. It happens either when a mass of plasma cells grows out of a vertebra into the spinal canal, the paraspinal mass shown on the MRI, or when a vertebral body weakened by lytic disease collapses and the fragments press on the cord. A patient with myeloma who develops back pain with weakness or numbness in the legs, or any change in bladder or bowel control, needs an urgent MRI of the spine the same day. Delay costs the patient the ability to walk; recognised early, the cord can be decompressed and function saved.
Peripheral neuropathy is the chronic problem, and it has two causes shown side by side in the nerve illustration. The monoclonal protein itself can deposit in and damage peripheral nerves. And several of the drugs used to treat myeloma are toxic to nerves, so a neuropathy may appear or worsen during treatment. Ask about numbness and tingling in the feet and hands at every visit, before treatment and during it, so that the two causes can be told apart.
The differential: Waldenström's macroglobulinemia and the problem of the big molecule
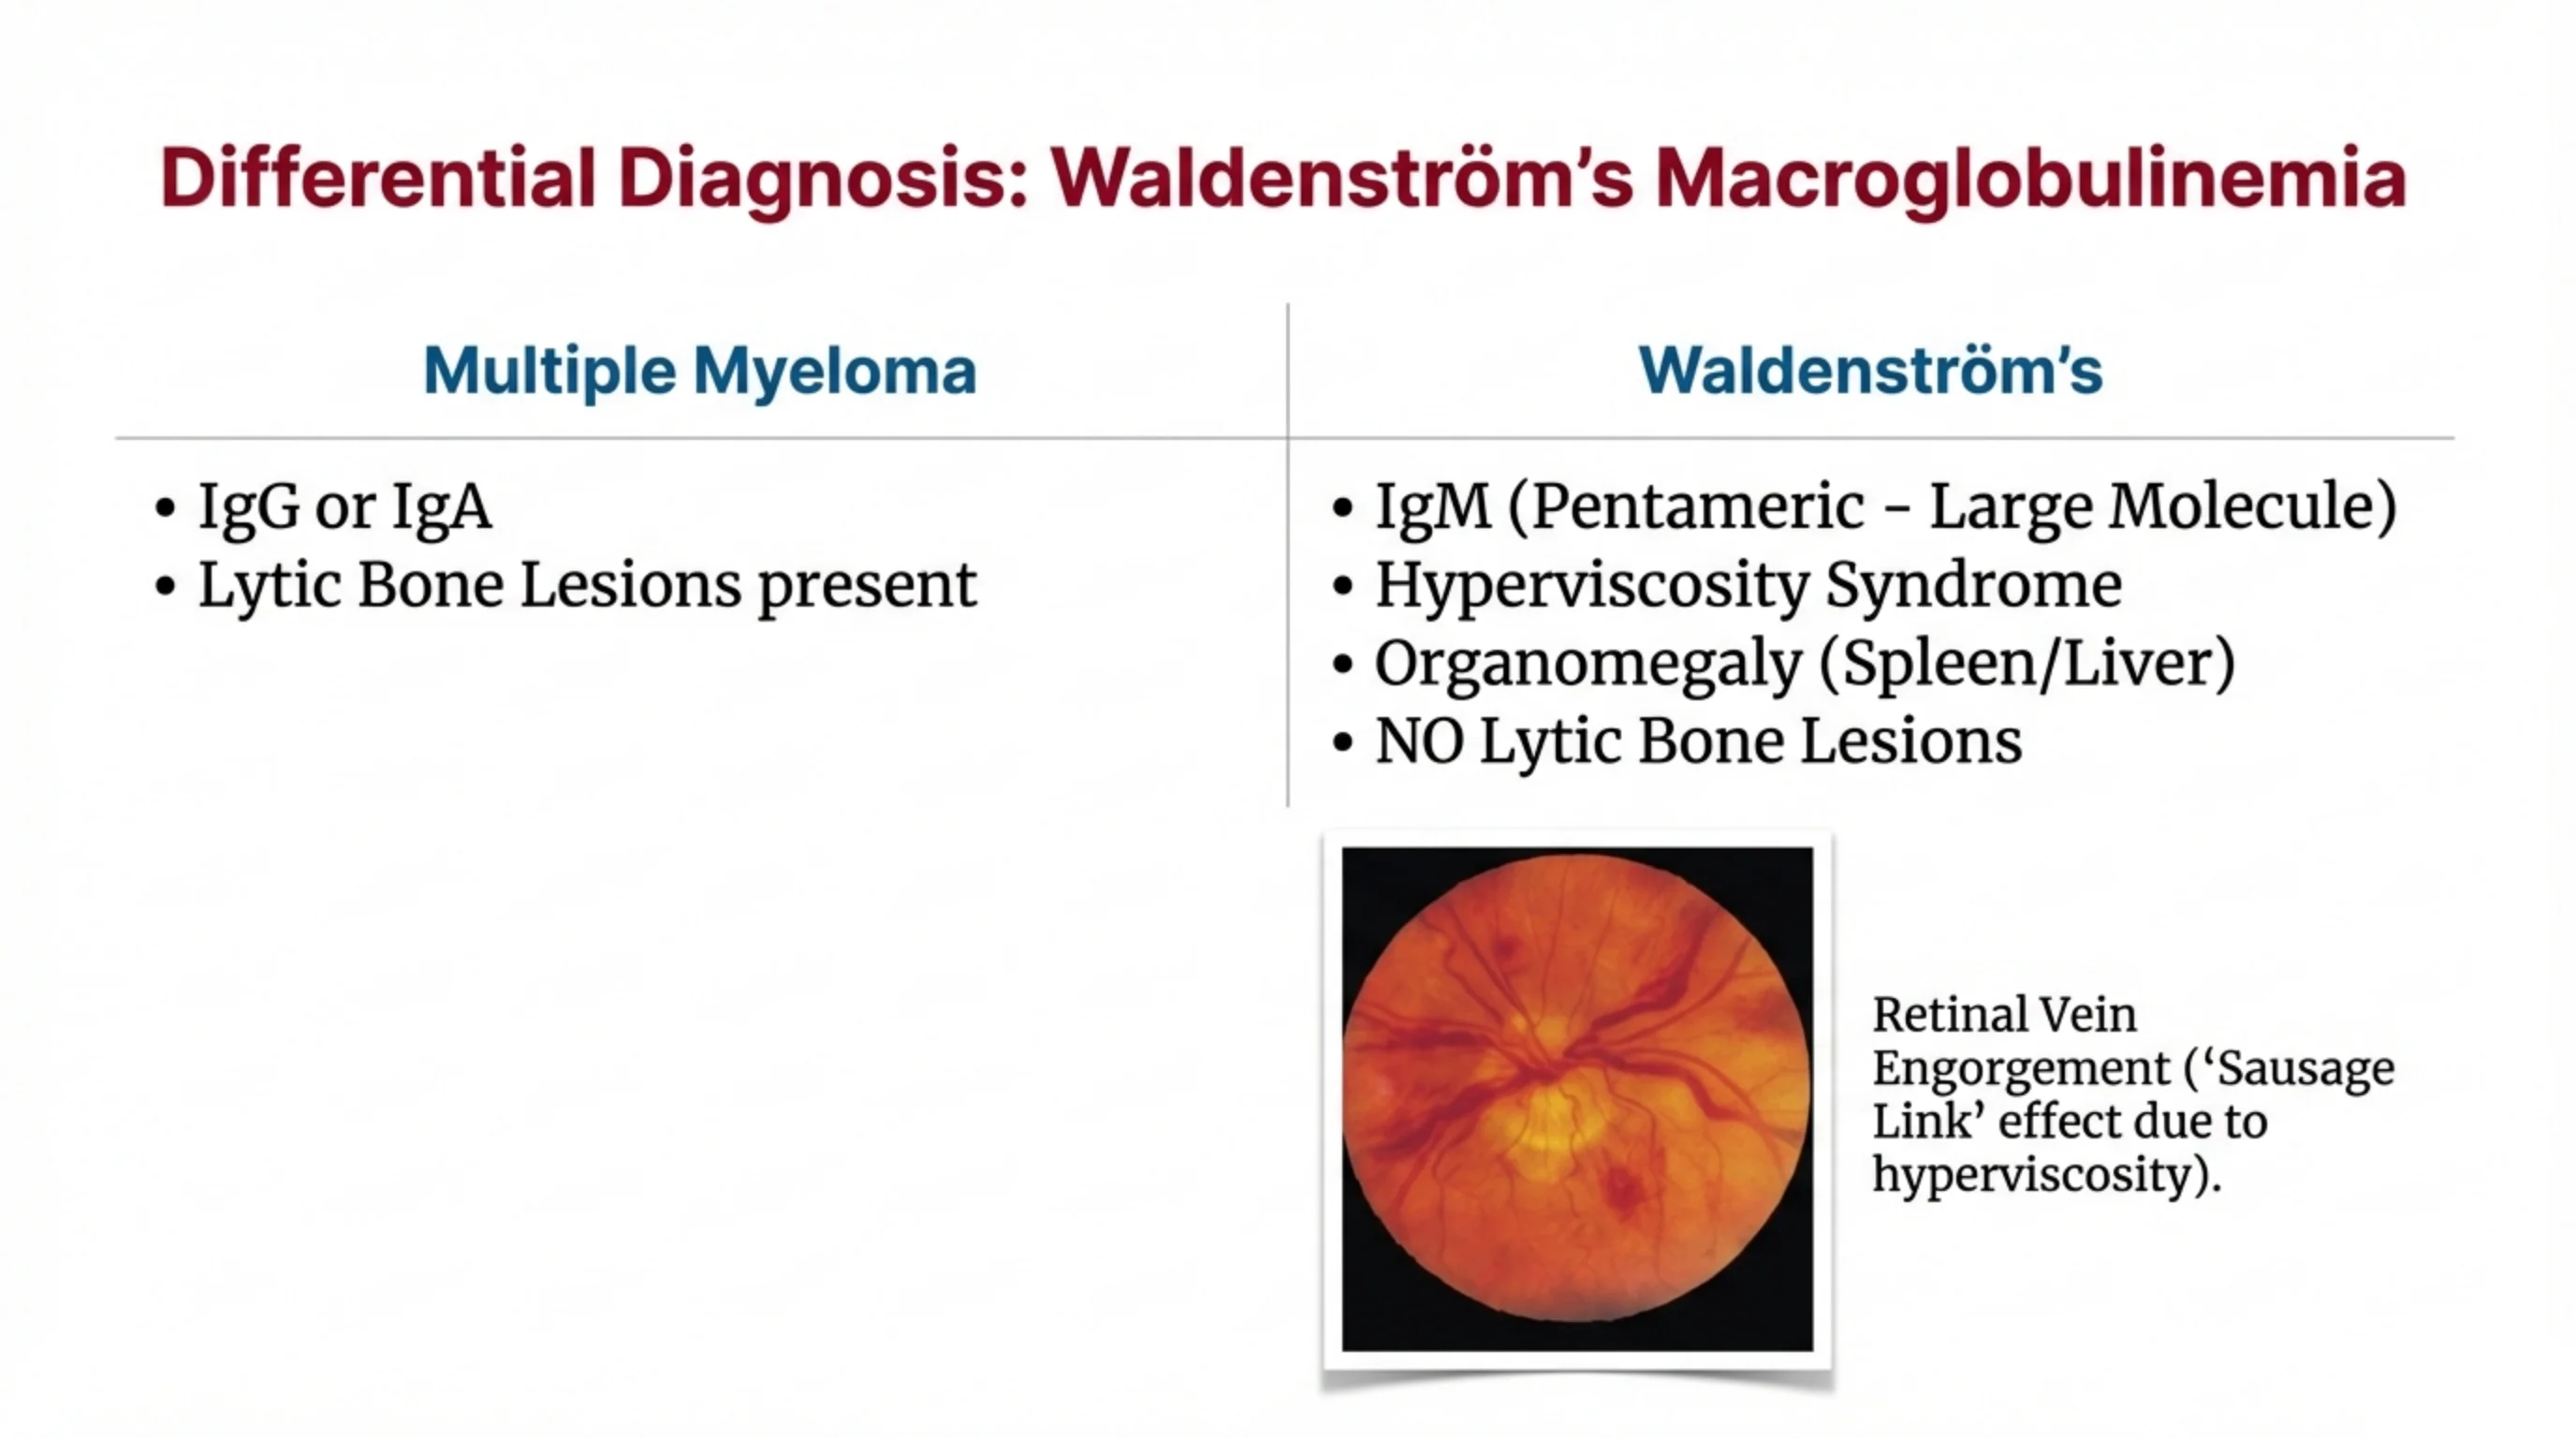
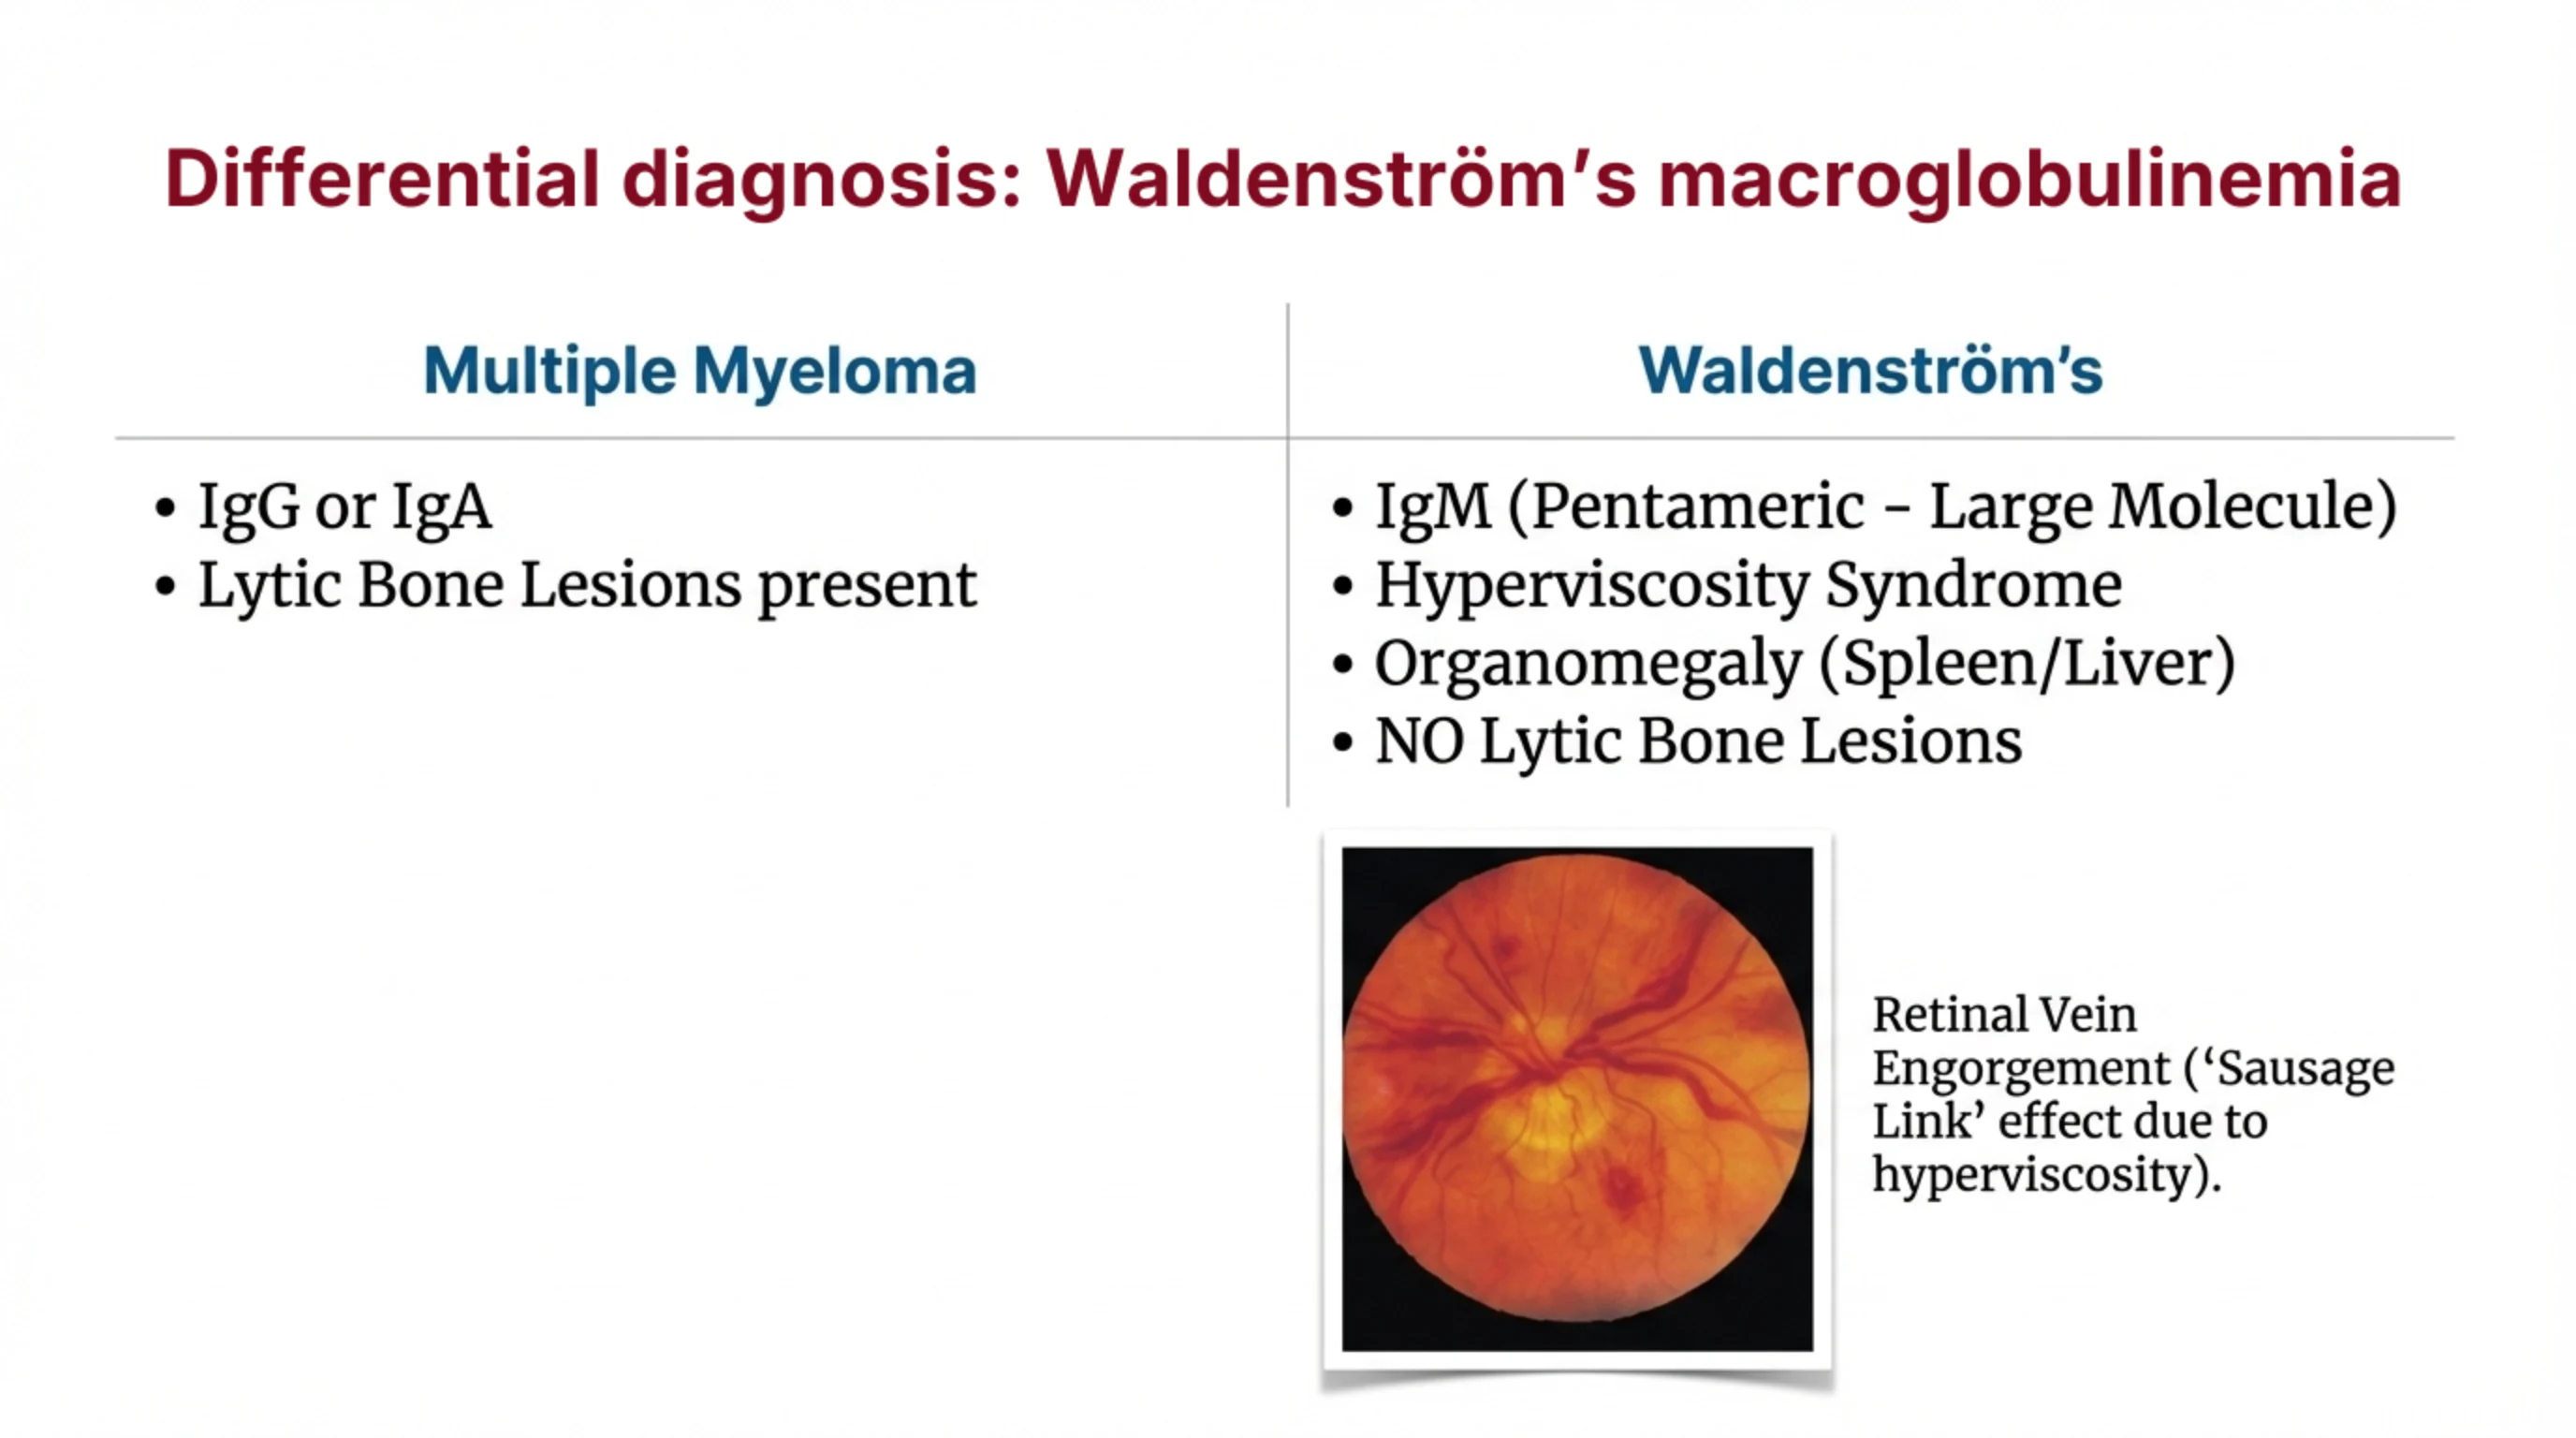
An M-spike is not always myeloma. The closest mimic is Waldenström's macroglobulinemia, and the table on the slide sets the two side by side. The first difference is the class of paraprotein. Myeloma is IgG or IgA; Waldenström's is IgM. The second difference is a consequence of the first. IgM circulates as a pentamer, five antibody units joined together, and it is a very large molecule. Large molecules in high concentration make the blood thick.
That is why the clinical pictures diverge. Myeloma damages bone and produces lytic lesions. Waldenström's does not produce lytic lesions at all; instead it produces the hyperviscosity syndrome, with headache, blurred vision, bleeding from the nose and gums, and confusion, together with enlargement of the spleen and liver because the disease behaves more like a lymphoma than a marrow tumour.
The fundus photograph is the sign to remember. In hyperviscosity the retinal veins become engorged and segmented, dilating between points of constriction until they look like a string of sausages. If you see this in a patient with an IgM paraprotein, the diagnosis is Waldenström's until proved otherwise, and the viscous blood needs to be dealt with urgently.
Confirming the diagnosis: three findings, and all three are needed
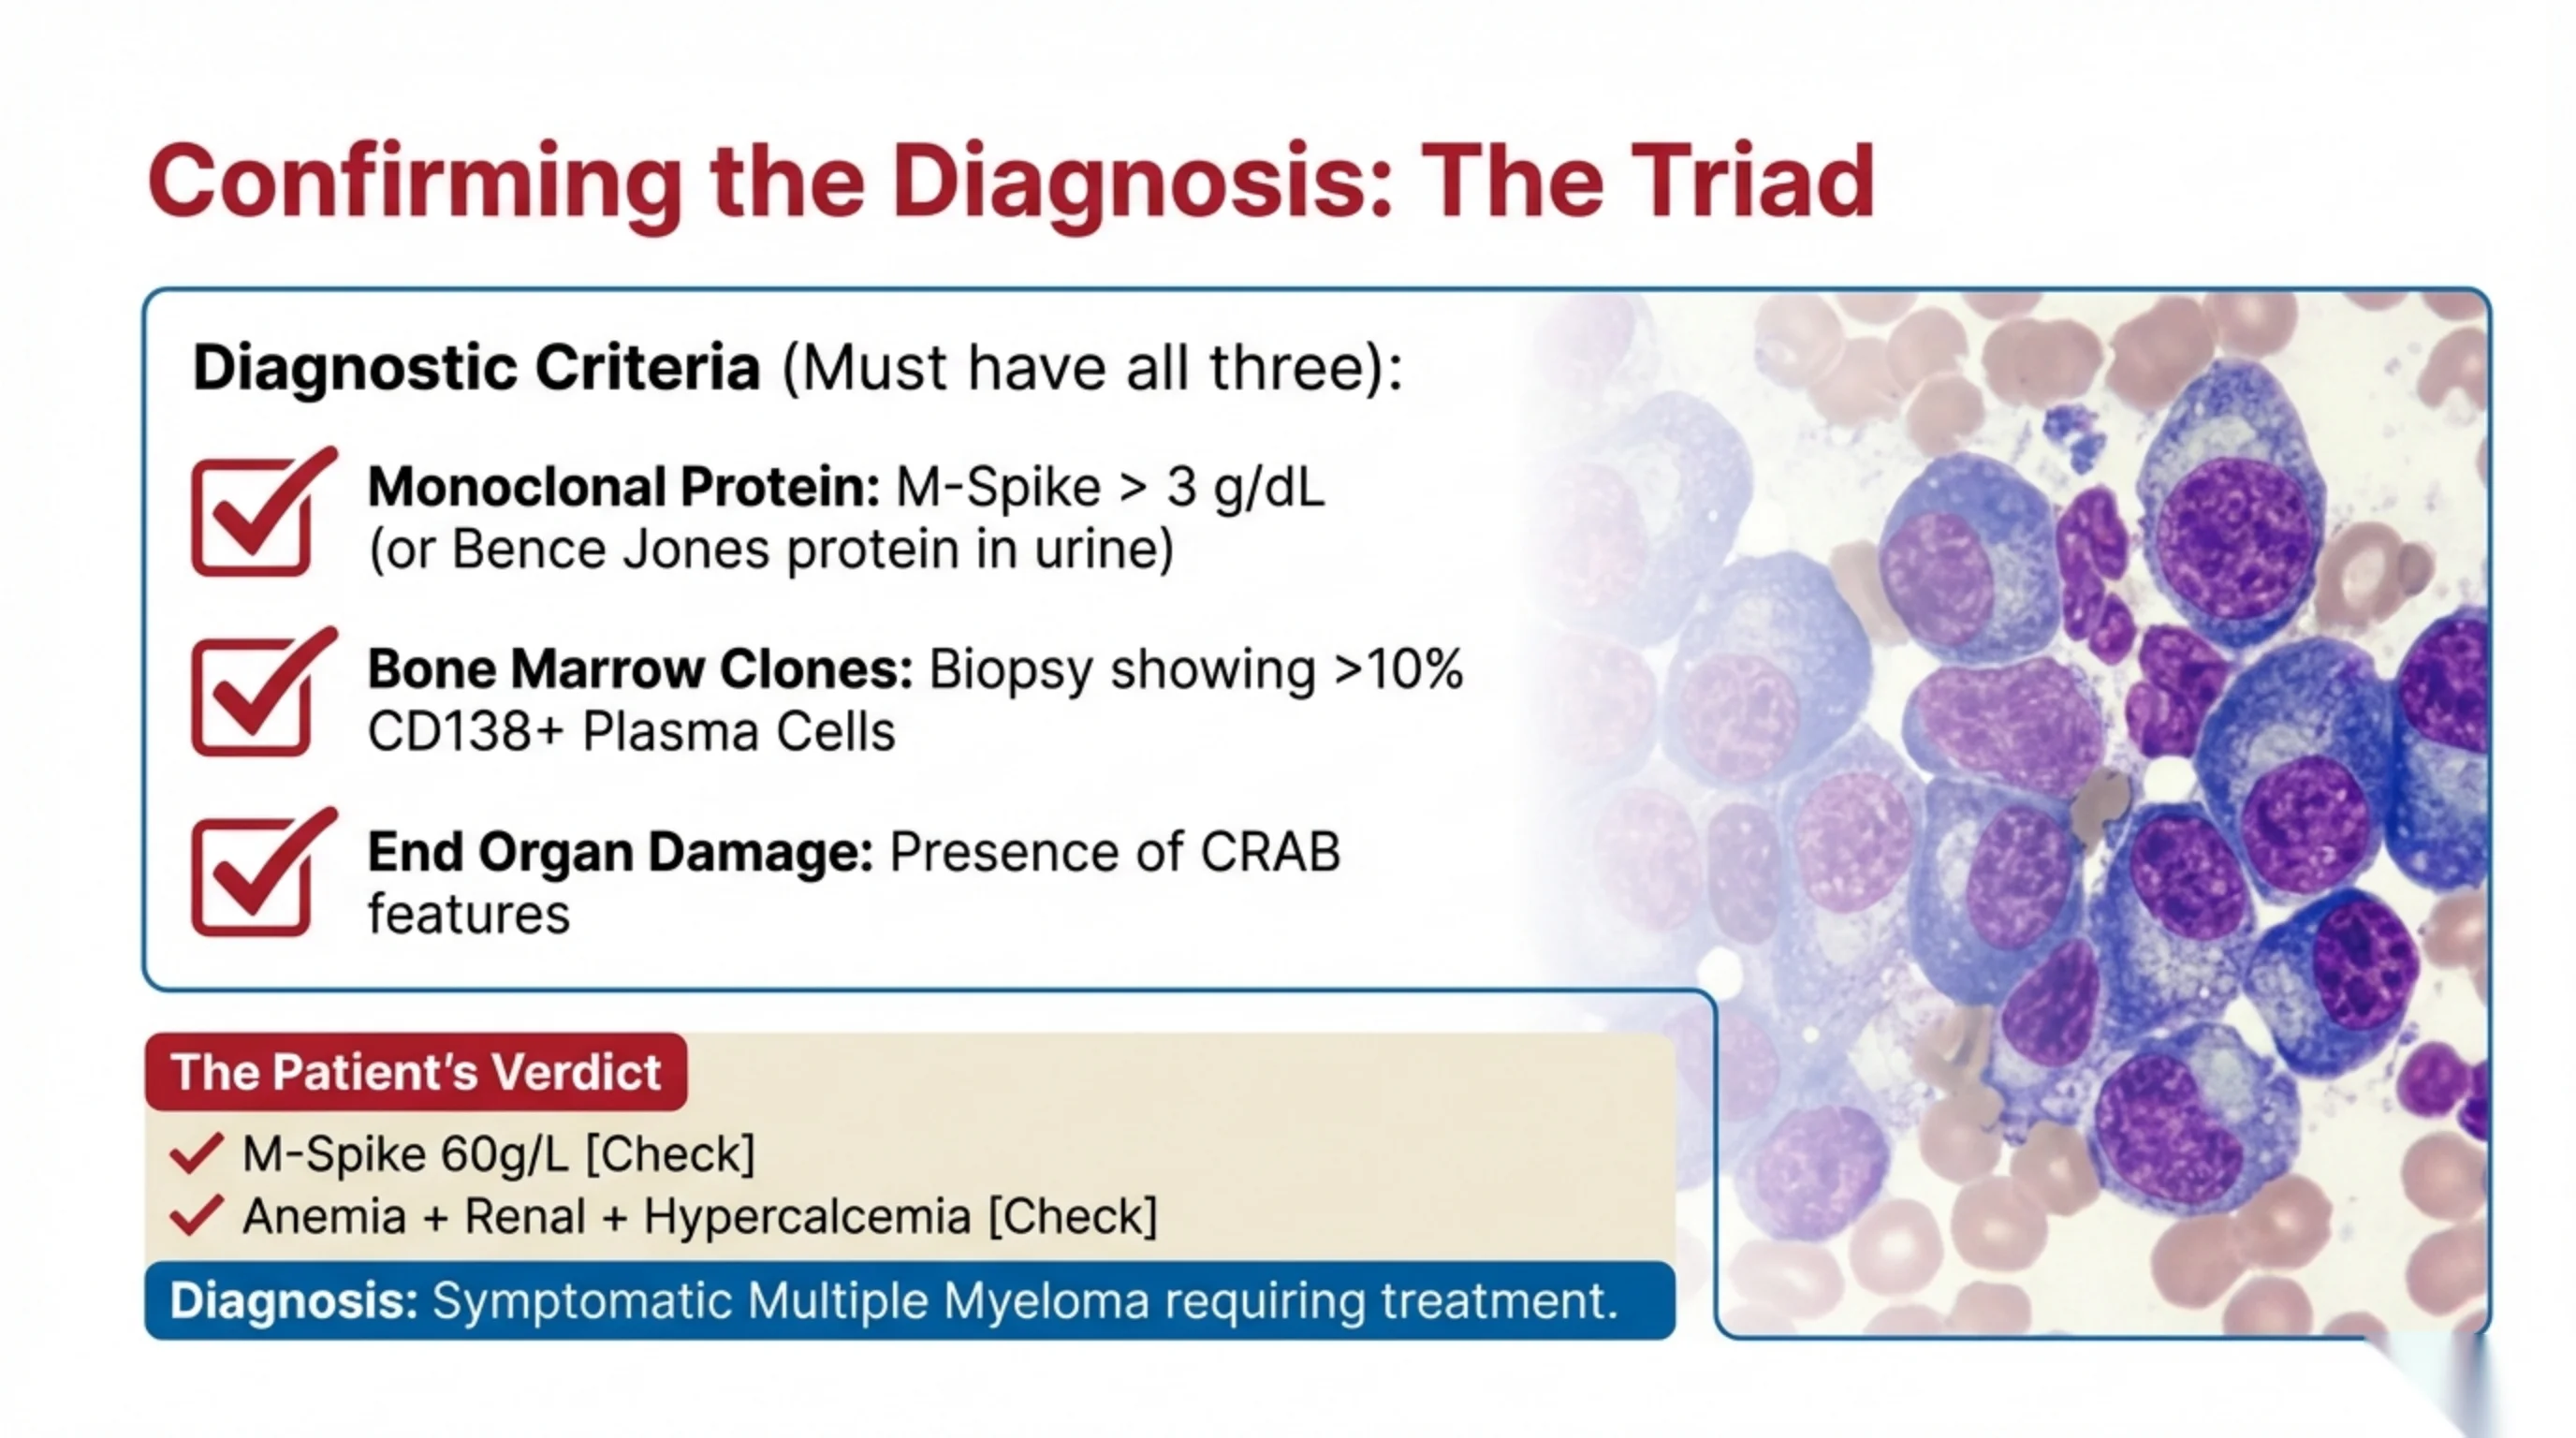
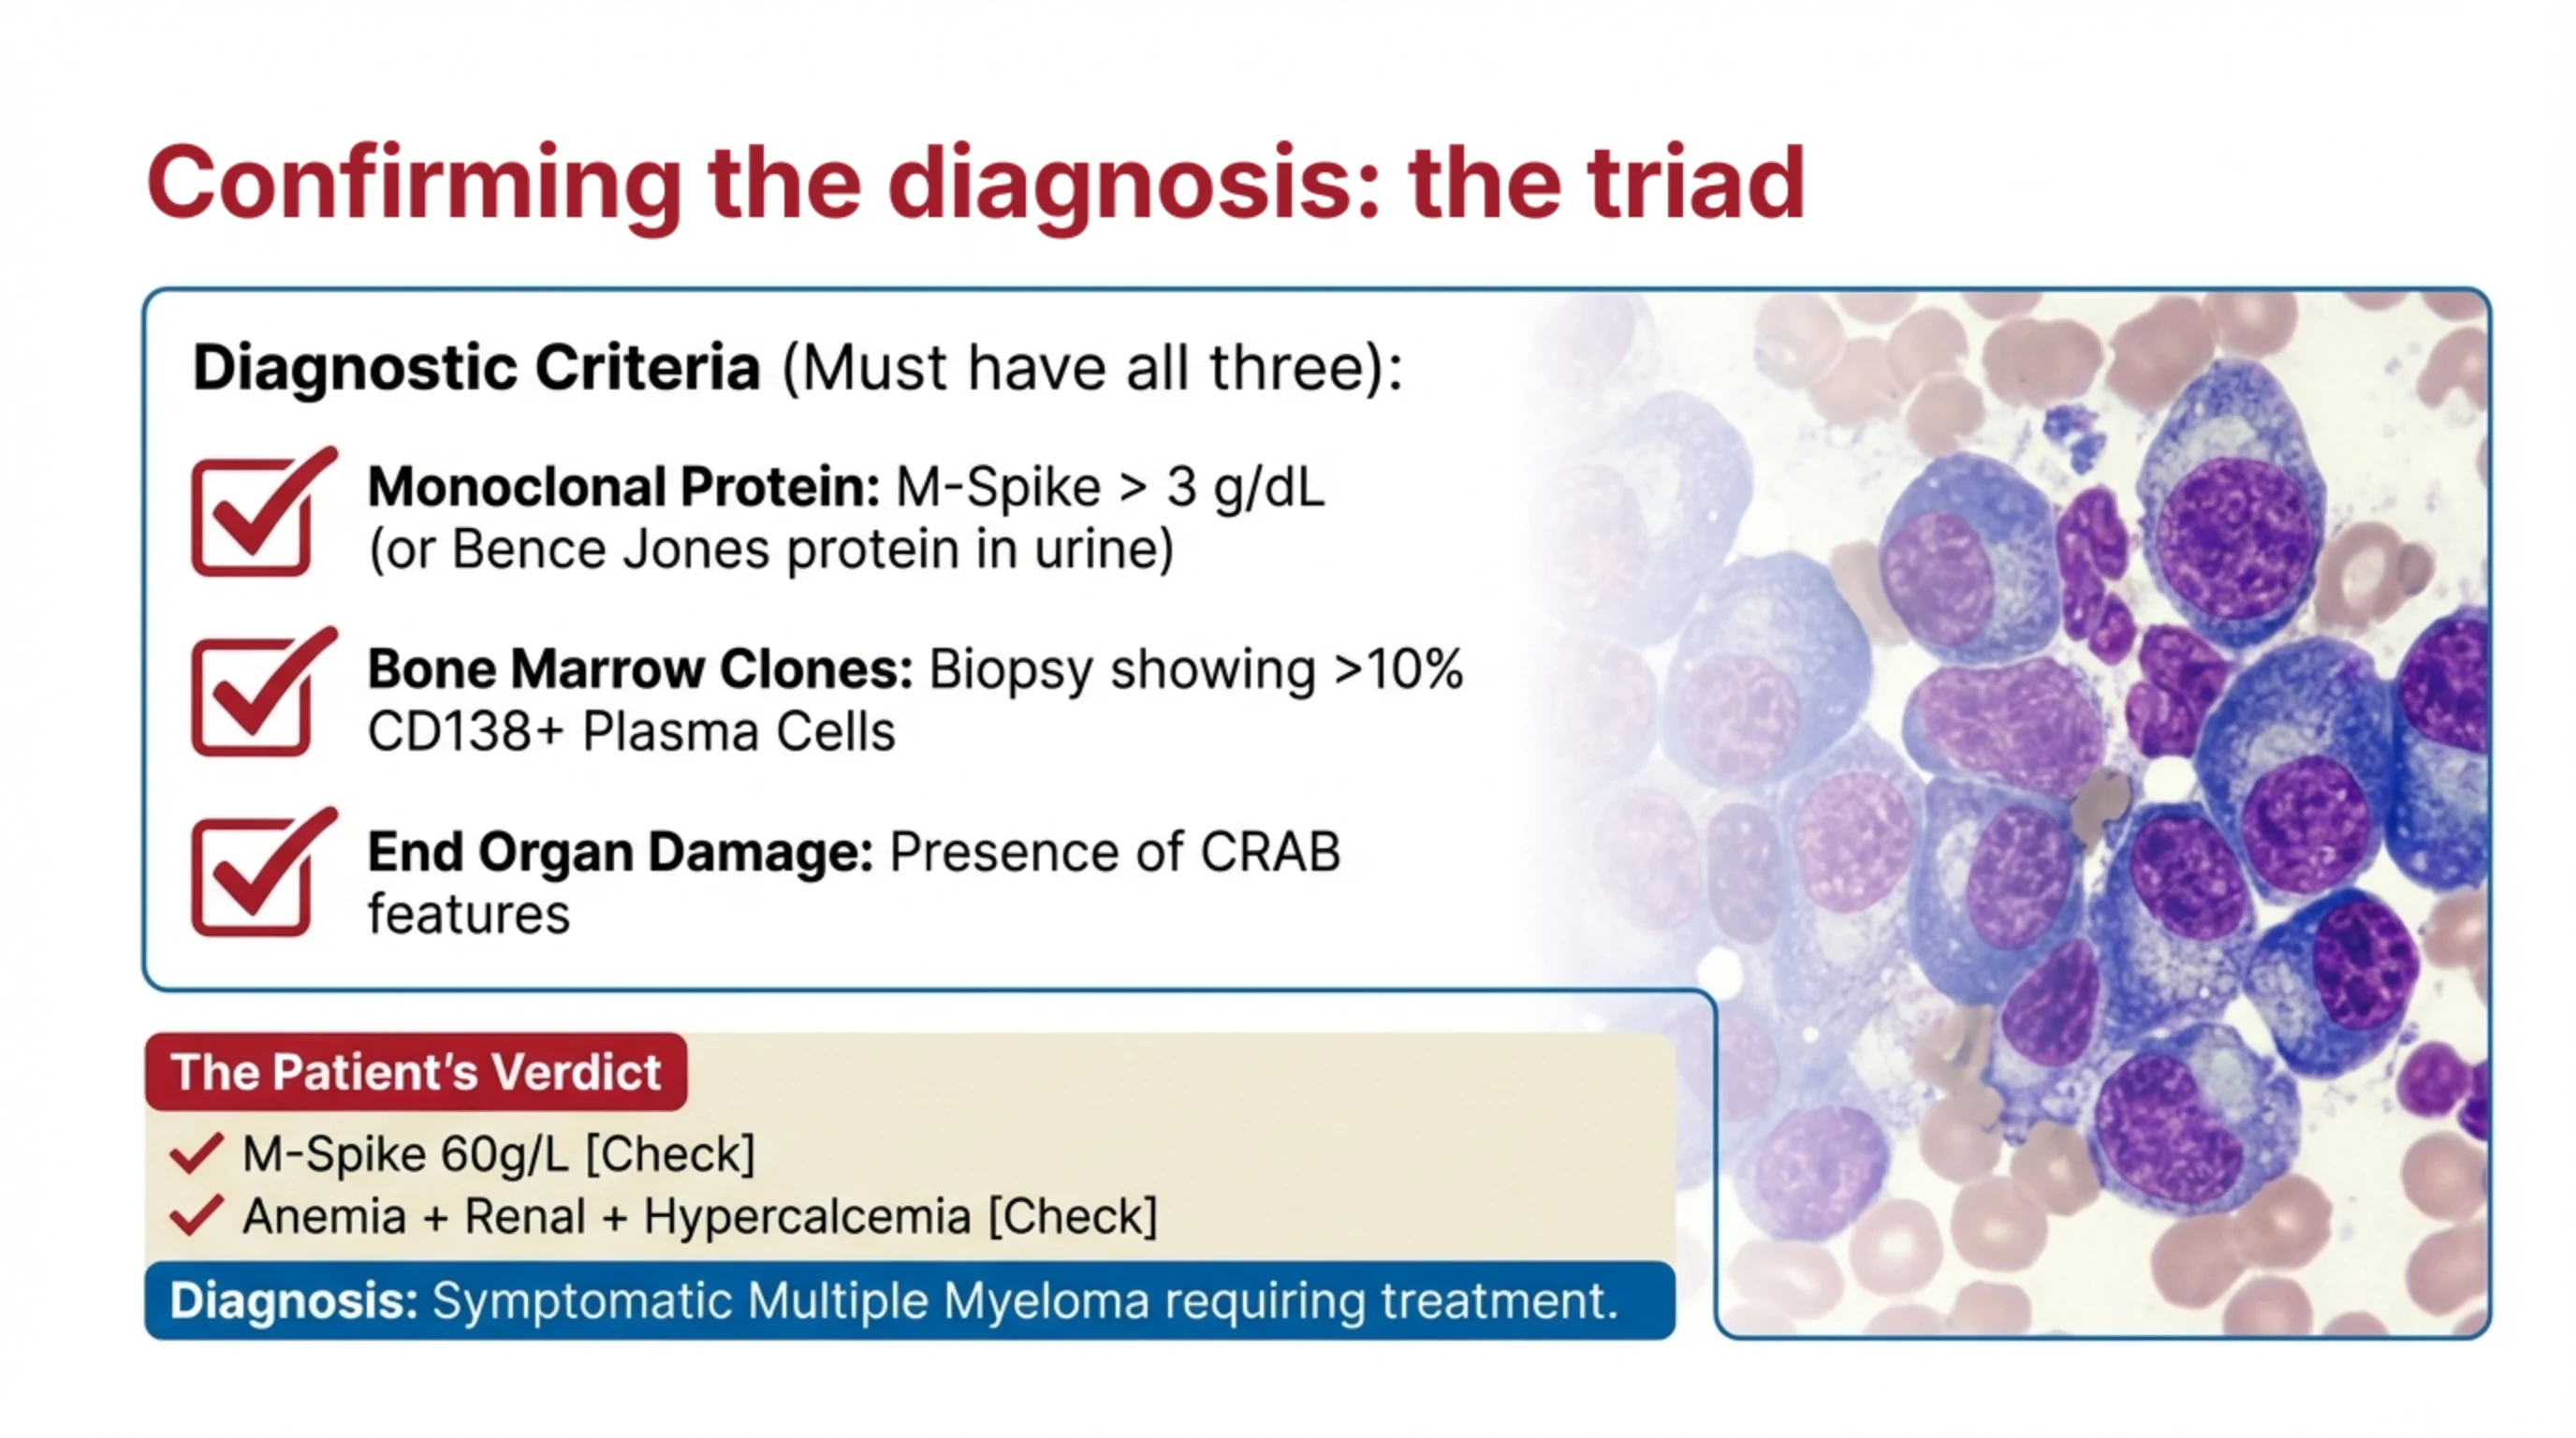
The diagnosis of symptomatic multiple myeloma rests on a triad, and the slide presents it as a checklist because each item must be ticked. The first is a monoclonal protein: an M-spike greater than 3 g/dL in the serum, or Bence Jones protein, that is free light chain, in the urine. The second is the clone in the marrow: a bone marrow biopsy showing more than 10 percent plasma cells, identified by the morphology you learned on slide 3 and confirmed by staining for CD138, a surface marker that plasma cells carry. The third is end-organ damage, one or more of the CRAB features.
The reason all three are required is the spectrum on slide 9. A paraprotein alone might be MGUS. A paraprotein with excess plasma cells but no symptoms is smoldering myeloma. It is the addition of organ damage that makes the disease myeloma and the treatment necessary.
The patient's verdict follows directly. His IgA spike of 6 g/dL is far above the threshold. He has anemia, renal insufficiency and hypercalcemia, three CRAB features. The marrow smear on the slide shows sheets of plasma cells. The diagnosis is symptomatic multiple myeloma, and he requires treatment.
Read next. Case 57 · Multiple Myeloma in the casebook is a second patient with this disease. He has all four CRAB features on his first blood tests, and the case adds two traps that delay the diagnosis: the urine dipstick does not detect Bence Jones protein, and in light-chain-only myeloma the serum electrophoresis can be normal, so the free light chain assay is sent alongside it.
See it online.
- Plasma cells filling a marrow core biopsy in myeloma ASH Image Bank
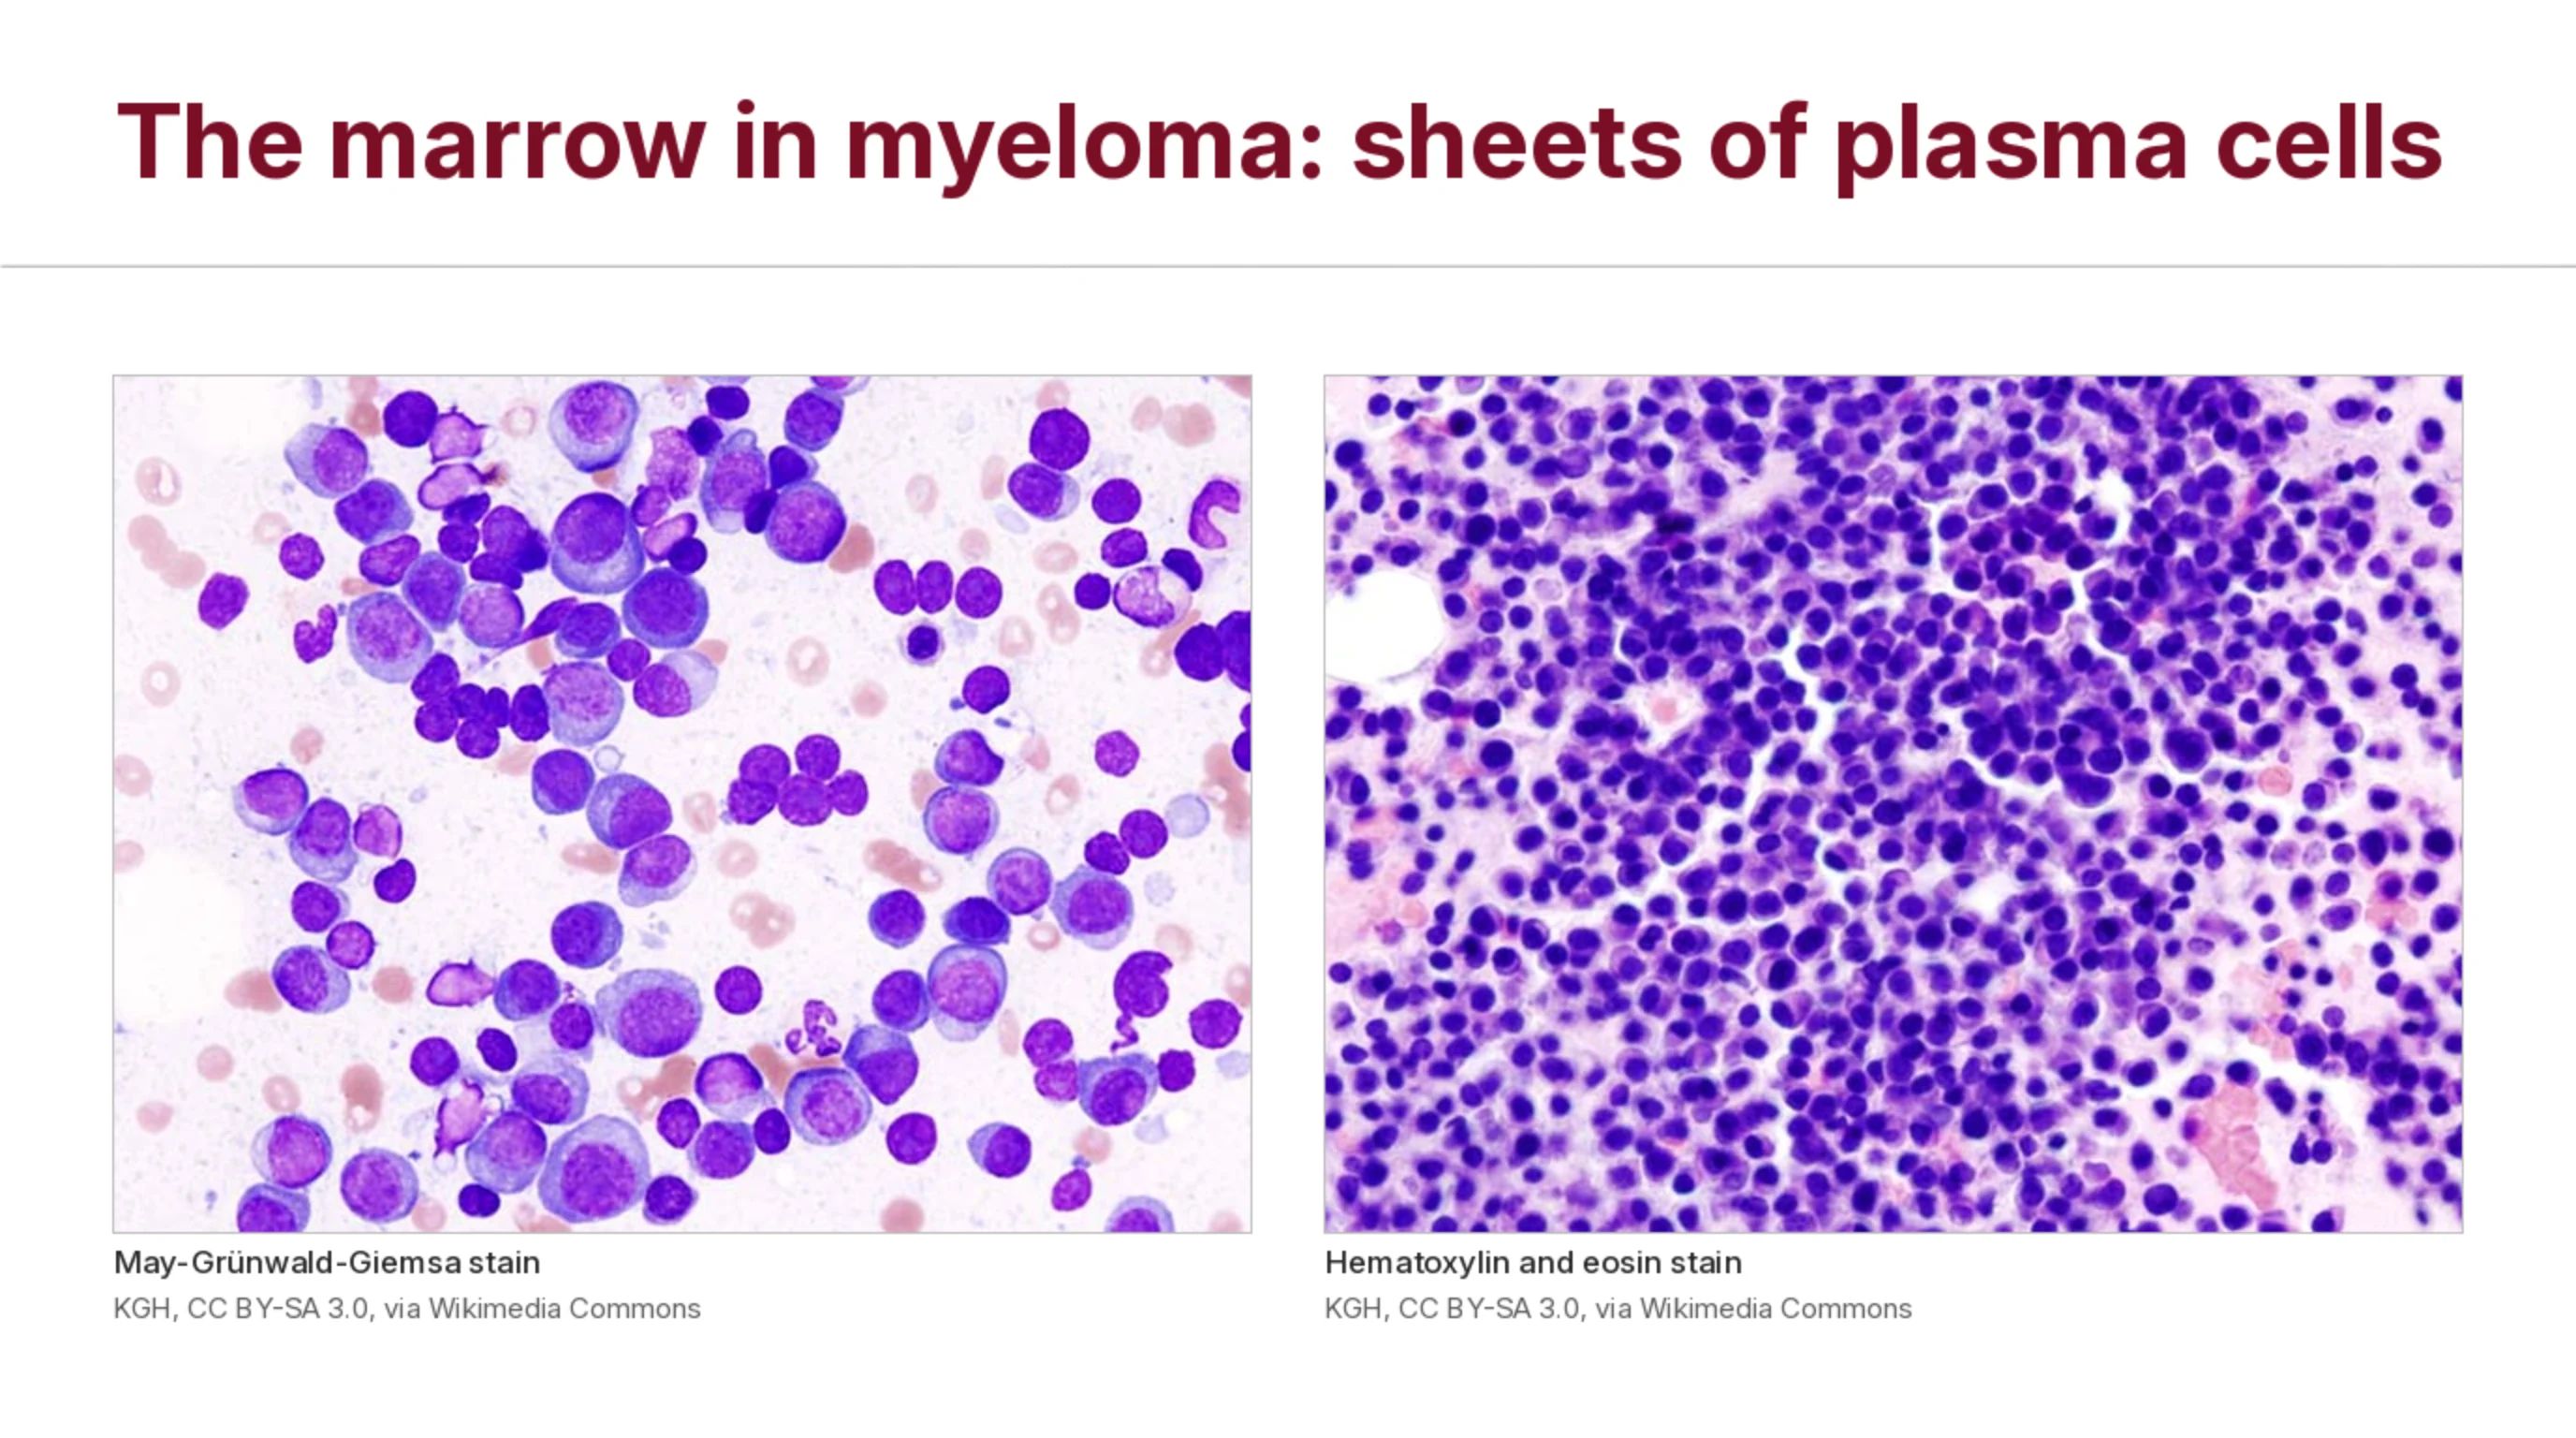
The second criterion, on a real marrow
The previous slide made the marrow one of the three findings that must all be present: a biopsy with more than 10 percent plasma cells. These two pictures show what that looks like in a patient with myeloma.
On the left is a film stained with May-Grünwald-Giemsa. Most of the nucleated cells in this field are plasma cells. Look for the features from slide 3: the nucleus pushed to one side, the deep blue cytoplasm, the pale zone next to the nucleus. You do not need to count here; the plasma cells are far above 10 percent.
On the right is the same case in a hematoxylin and eosin stain. At this magnification you cannot study each cell, but you can see the pattern: the field is packed with one kind of cell, in sheets, leaving little room for normal marrow. That crowding is one of the two causes of the anemia on slide 14.
Image source.
- Multiple myeloma marrow, May-Grünwald-Giemsa stain Wikimedia Commons · CC BY-SA 3.0 · KGH
- Multiple myeloma marrow, hematoxylin and eosin stain Wikimedia Commons · CC BY-SA 3.0 · KGH

Summary and epidemiology
The closing slide places the disease in context. Myeloma is a disease of older people: the median age at diagnosis is 65 to 70 years, with a slight male predominance. It accounts for about 1 percent of all cancers and 10 percent of hematological malignancies, which makes it one of the commonest blood cancers you will see. Its cause is generally unknown; the associations recorded are exposure to ionising radiation and to benzene, and chronic antigenic stimulation, which fits with a disease of the antibody-producing cell.
The takeaway the slide asks you to keep is the progression: from an asymptomatic paraprotein found by chance, MGUS, through the silent accumulation of smoldering myeloma, to the toxic end-organ effects of symptomatic disease, which are the CRAB criteria. Everything else in the lecture hangs on that line.
If you remember one clinical pattern, make it the one our patient presented with: an older adult with fatigue, a high calcium, a raised creatinine, an anemia, and a total protein out of proportion to the albumin. Order the protein electrophoresis.