Introduction to Bleeding Disorders
The hemostatic system from platelets to fibrinolysis — physiology and the coagulation cascade.
These slides are an outline only. Read the accompanying material with them: the notes under each slide below, and Chapter 20, Principles of Hemostasis, in the Hematology Handbook. Then work through the Internal Medicine Casebook and the Hematology Question Bank.
What this lecture is about
These slides are an outline only. Read the accompanying material with them: the notes under each slide on this page, and Chapter 20, Principles of Hemostasis, in the Hematology Handbook. Then work through the Internal Medicine Casebook and the Hematology Question Bank.
This is the physiology lecture that the clinical lectures on bleeding and thrombosis rest on. Its subject is hemostasis: how the body stops blood escaping from a damaged vessel, and, just as important, how it keeps the blood liquid everywhere else. Bleeding disorders and thrombotic disorders are both failures of this system, in opposite directions, and neither can be understood without it.
The lecture organises the whole process around four verbs that you will see highlighted on slide after slide: START the plug, MAKE the clot, STOP the reaction, and CLEAN up afterwards. If you can describe what happens at each of the four, which cells and proteins do the work, and which laboratory test measures it, you have the foundation for everything that follows.
Objectives, and the balance the whole system is built on
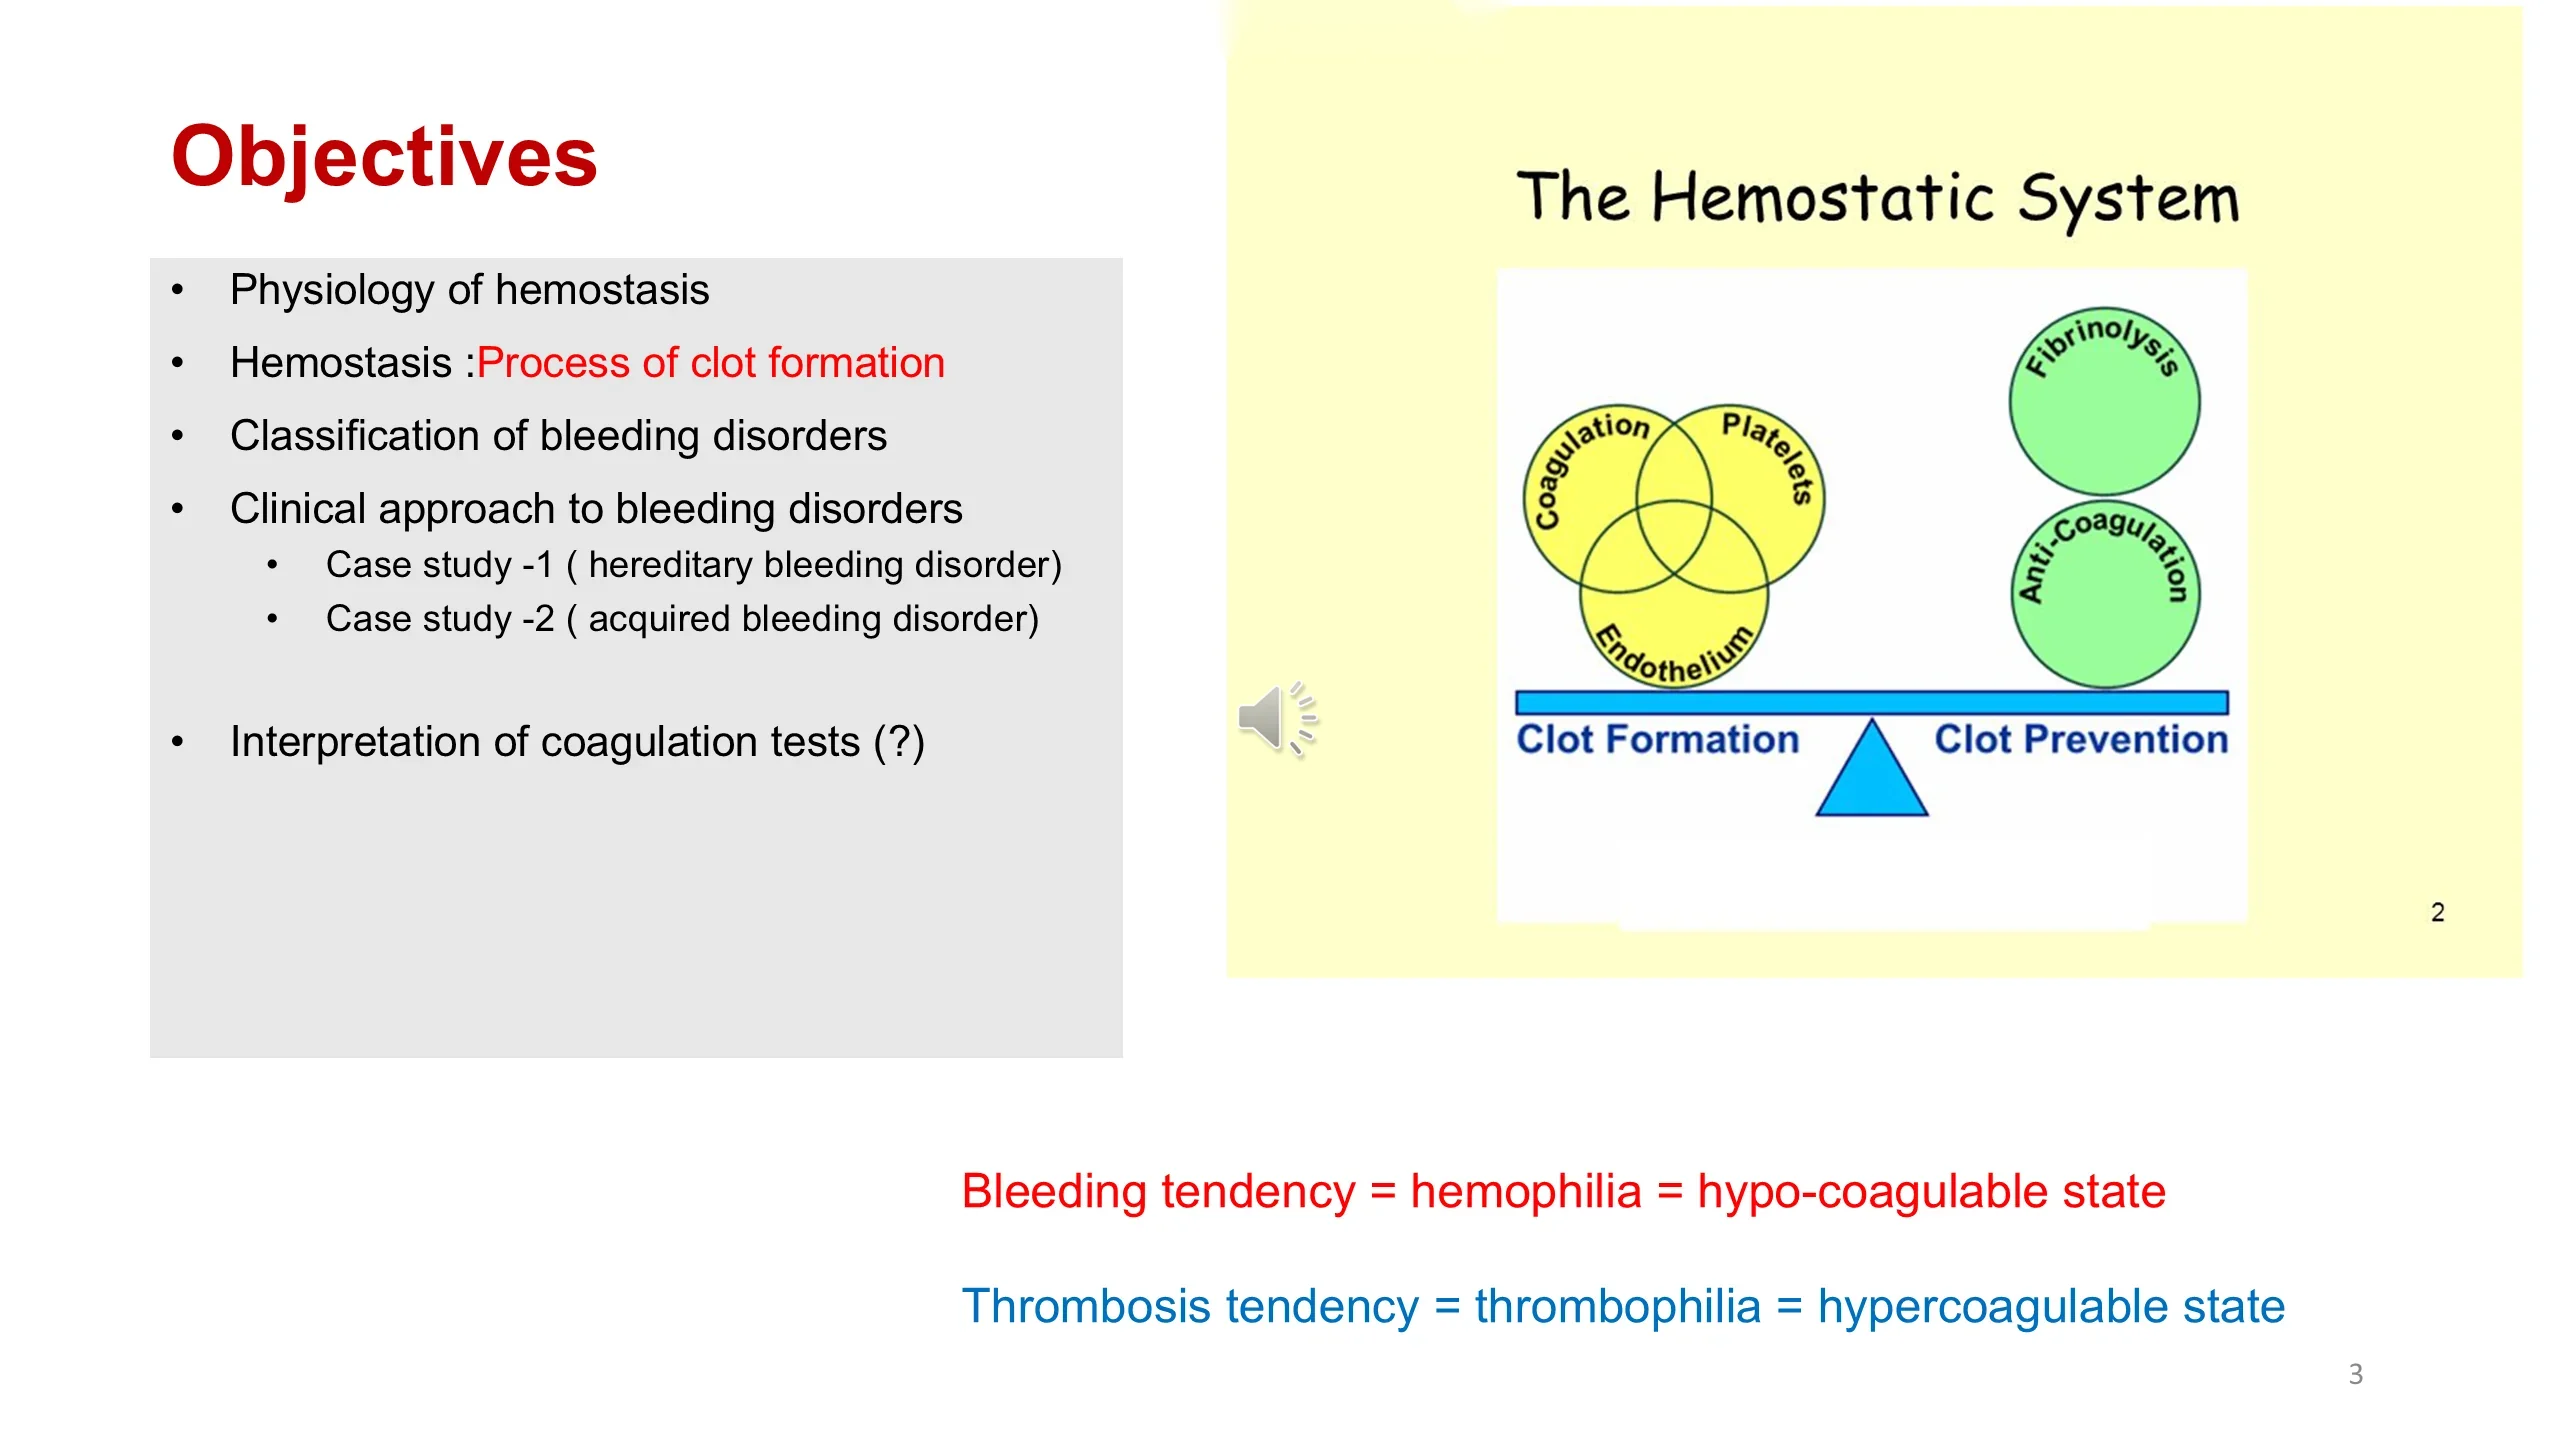
The objectives on the left set out the course: the physiology of hemostasis and the process of clot formation, which this deck covers, and the classification of bleeding disorders, the clinical approach, two case studies and the interpretation of coagulation tests, which are taken up in the companion lecture on disorders of hemostasis.
The diagram on the right is the single most useful picture in the subject. Hemostasis is a balance. On one pan sit the forces of clot formation: the coagulation proteins, the platelets and the endothelium. On the other sit the forces of clot prevention: fibrinolysis, which dissolves clot, and the natural anticoagulants, which restrain its formation. In health the beam is level: blood clots at a wound and nowhere else.
The two equations beneath describe what happens when the beam tips. Tip it toward prevention and the patient bleeds: a bleeding tendency, of which hemophilia is the archetype, is a hypocoagulable state. Tip it toward formation and the patient clots: a thrombotic tendency, thrombophilia, is a hypercoagulable state. Every disorder in the coming lectures is a displacement of this balance, and every treatment is an attempt to restore it.
An interrelated process: the cycle from injury to stable plug
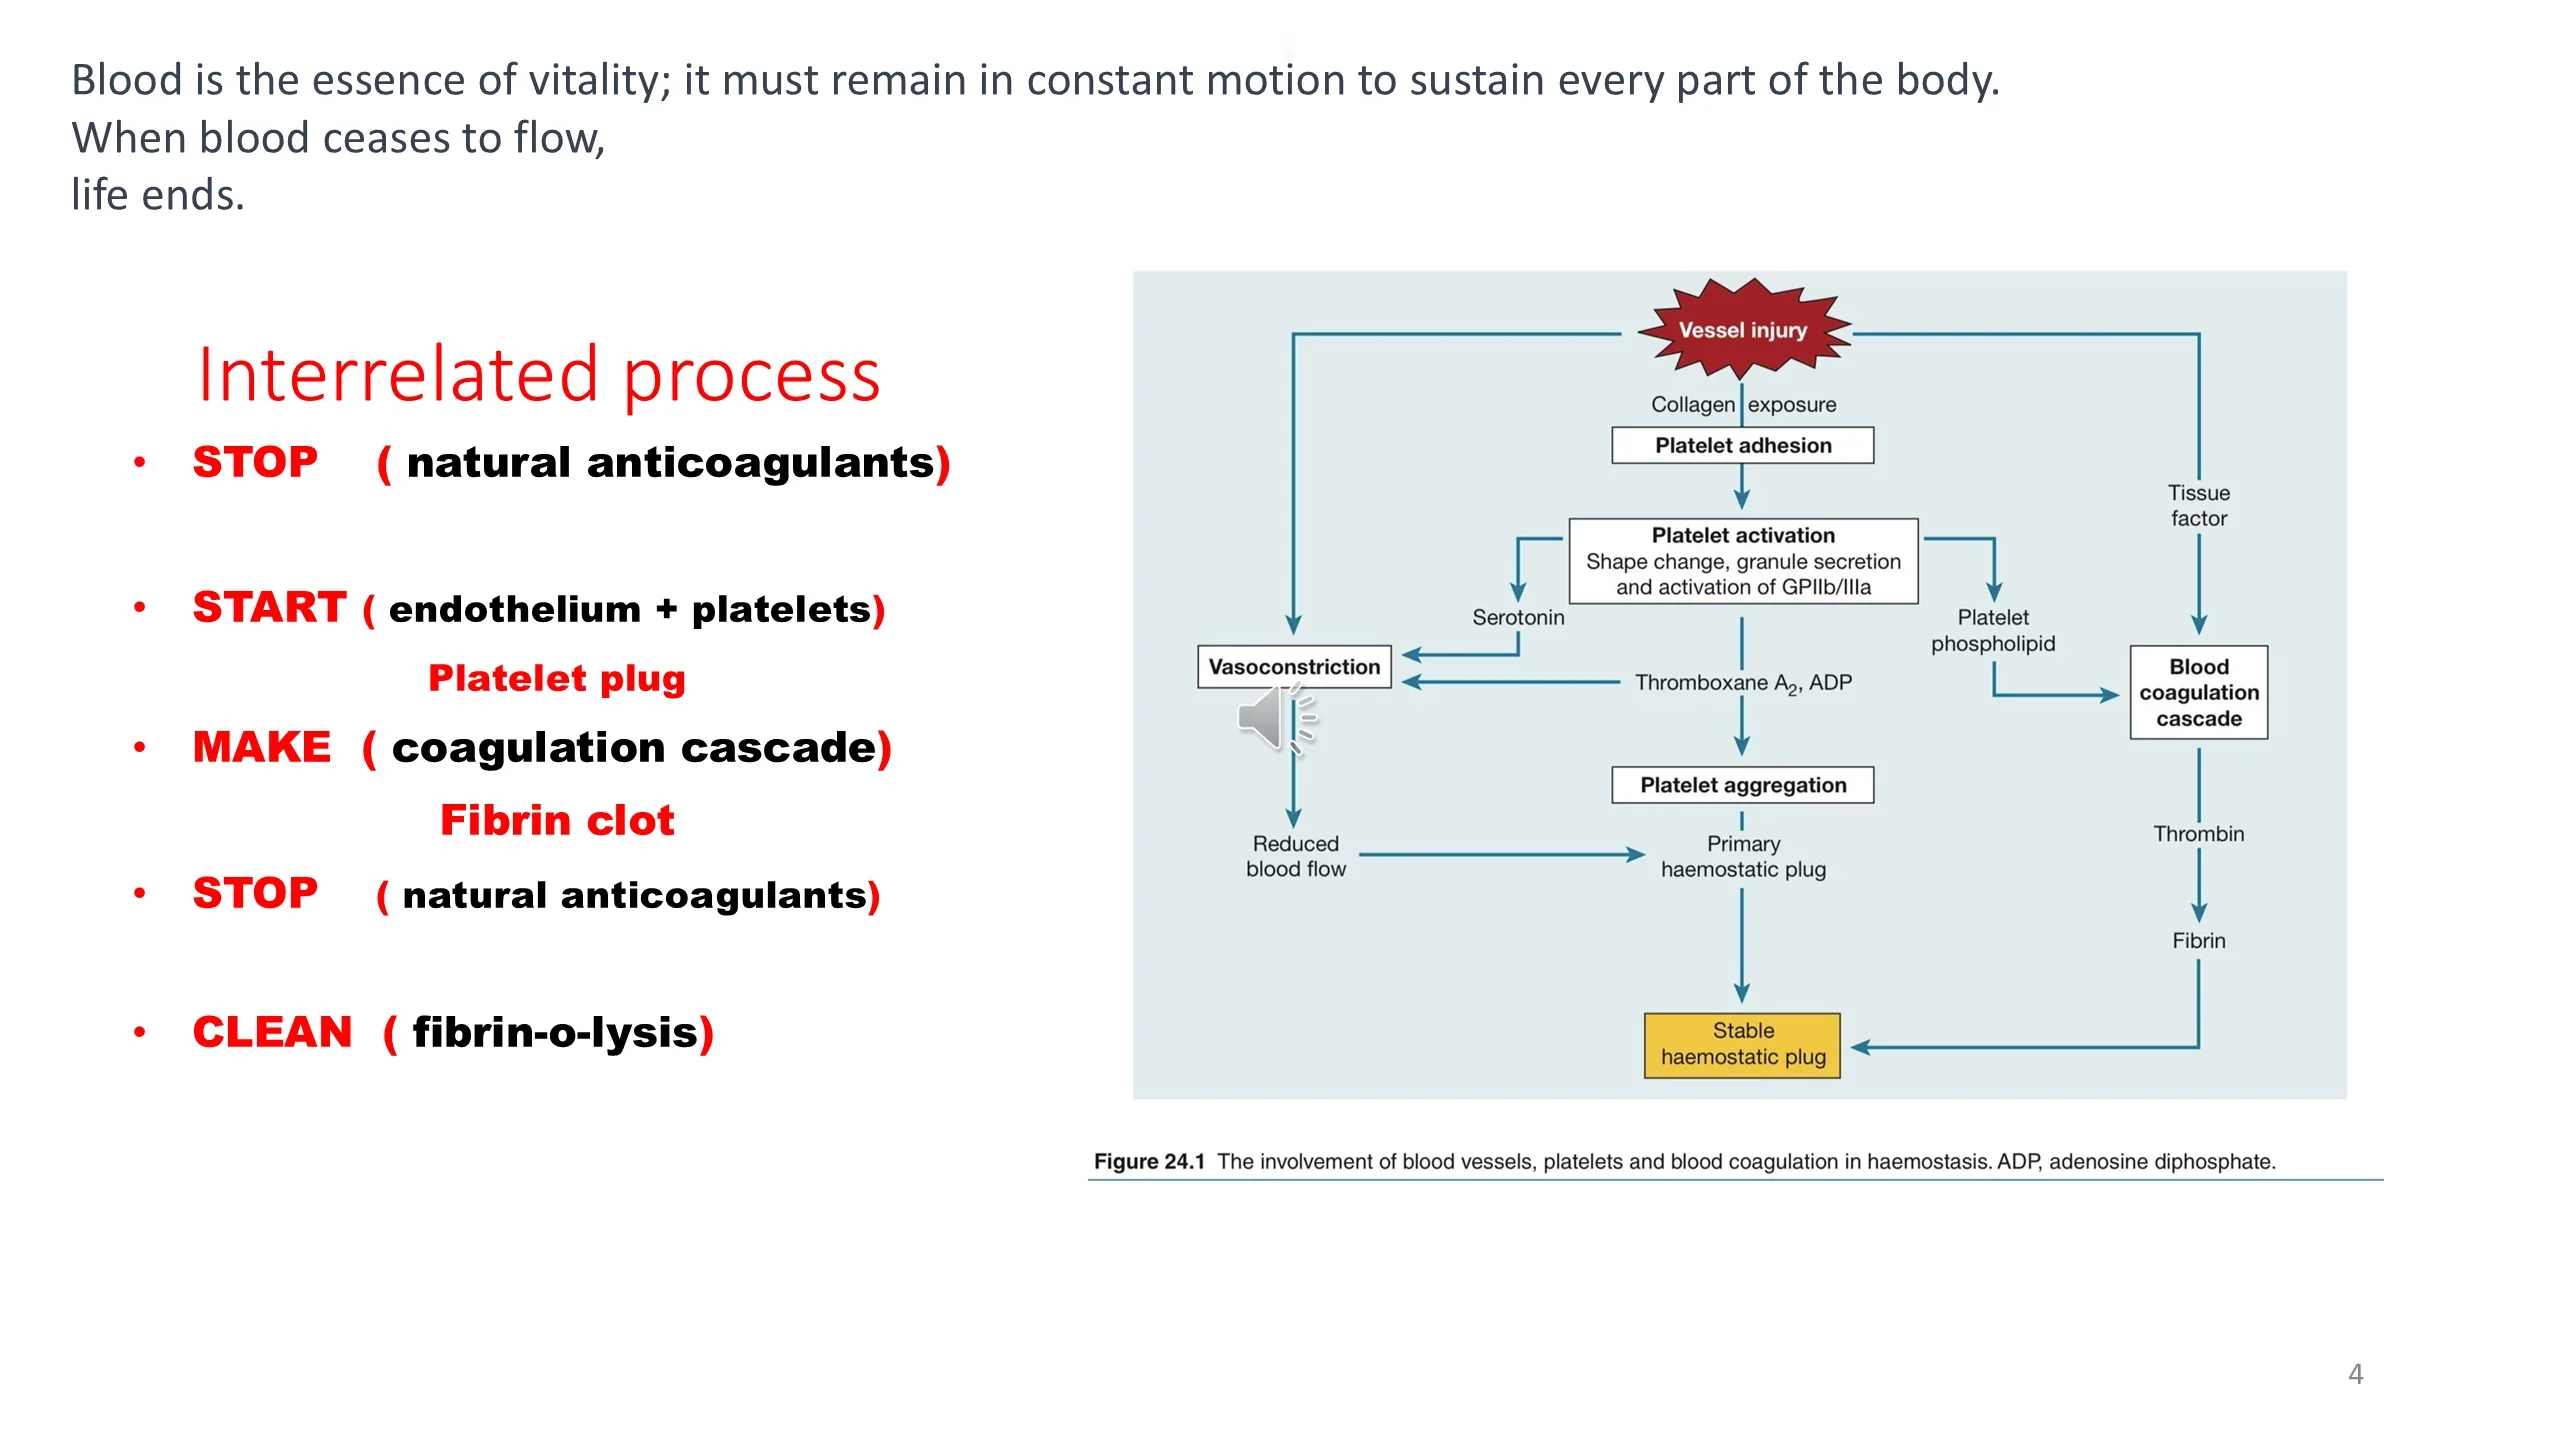
The epigraph makes the stakes plain. Blood must keep moving to sustain life, so the system that stops it leaking must act fast, and must act only where it is needed. The list on the left gives the sequence, and notice that it begins and ends with STOP. The resting state of the blood is anticoagulant. Hemostasis is a brief, local interruption of that state: START the platelet plug, MAKE the fibrin clot, STOP the reaction from spreading, CLEAN the clot away once the vessel has healed.
Figure 24.1 shows how the pieces connect. Injury to a vessel exposes two things that flowing blood never normally touches: collagen in the vessel wall and tissue factor in the tissues beneath it. Collagen captures platelets, which adhere, then activate, changing shape, secreting their granules and switching on the GPIIb/IIIa receptor. Activated platelets release serotonin, which constricts the vessel and slows the flow, and thromboxane A2 and ADP, which recruit more platelets into an aggregate: the primary hemostatic plug. Meanwhile tissue factor, together with the phospholipid surface that activated platelets provide, drives the coagulation cascade to thrombin, and thrombin makes fibrin.
The two arms converge at the bottom of the figure. Fibrin binds the platelet aggregate into a stable hemostatic plug. A platelet plug alone is fragile; fibrin alone has nothing to hold. Bleeding disorders are classified by which arm has failed, and that is why the primary and secondary hemostasis distinction runs through the clinical lecture.
Hemostasis is a process, and the endothelium is its switch
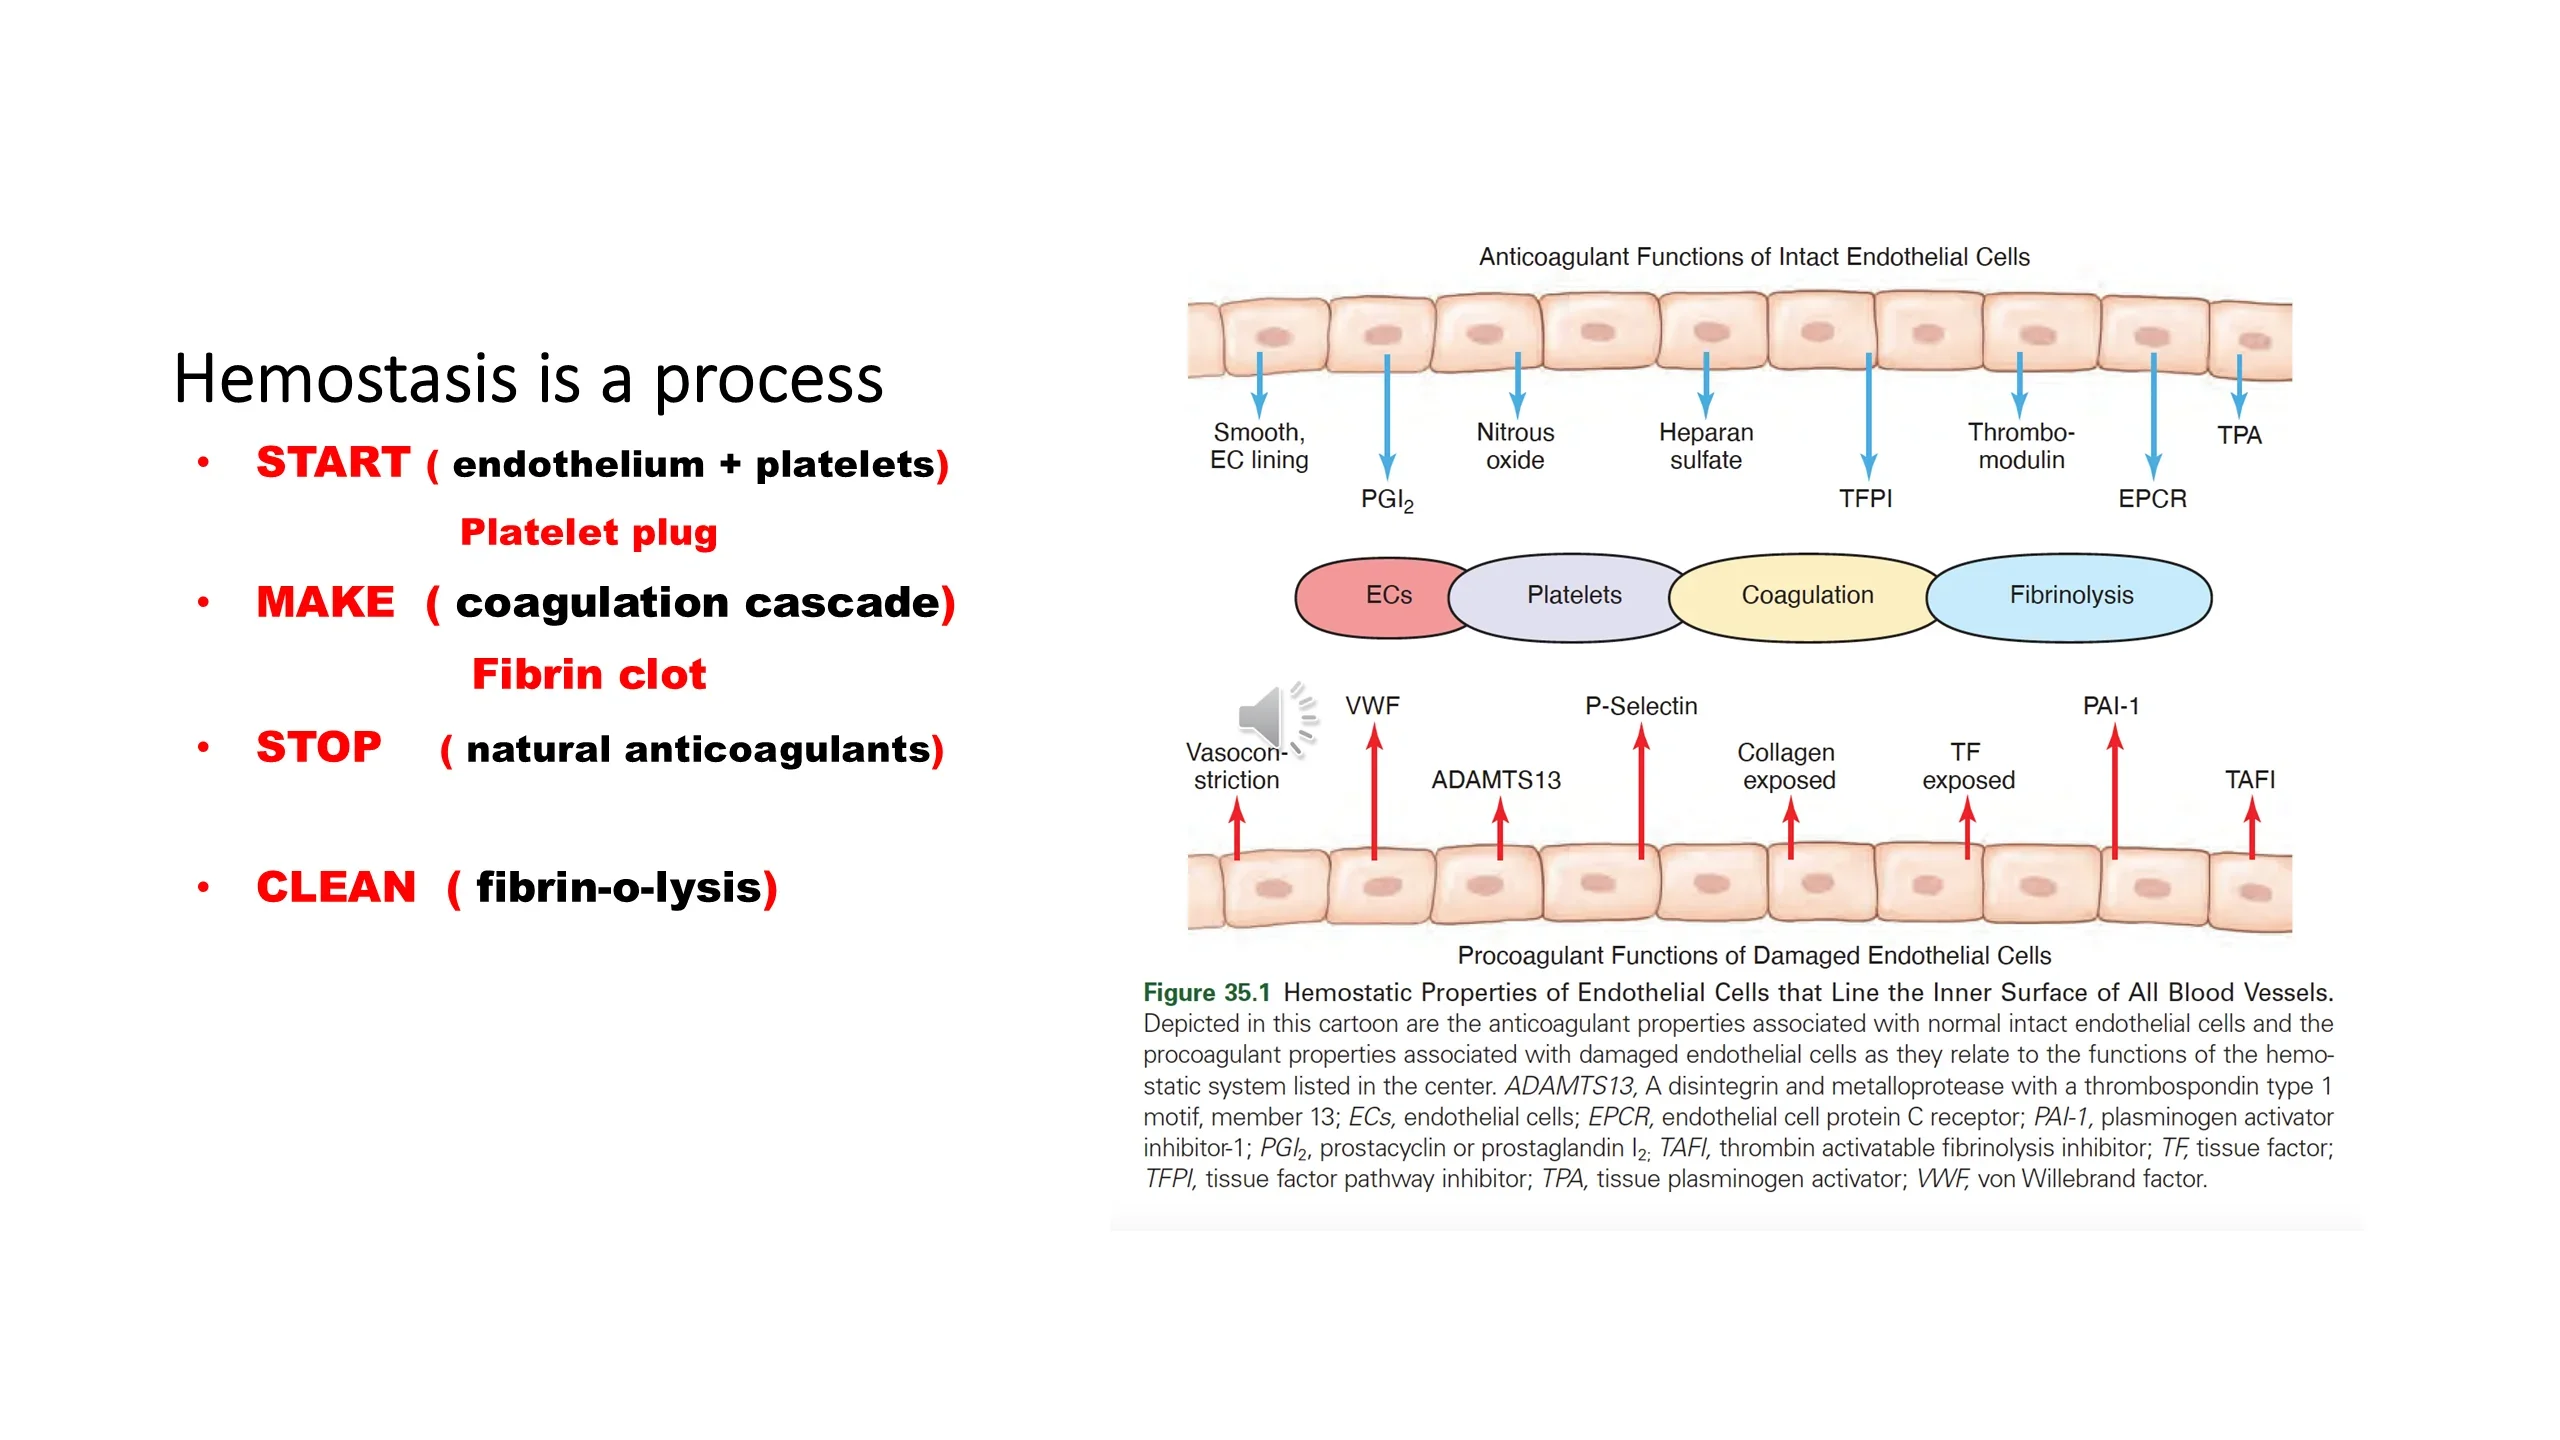
The central row of Figure 35.1 names the four players in order of appearance: endothelial cells, platelets, coagulation, fibrinolysis. The rest of the figure is about the first of them, because the endothelium decides whether the other three act at all.
The upper half shows the intact endothelium, which is actively anticoagulant. Its surface is smooth and offers platelets nothing to grip. It secretes prostacyclin and nitric oxide, which keep platelets quiet and vessels dilated. It displays heparan sulfate, which activates antithrombin, and thrombomodulin with the endothelial protein C receptor, which together activate protein C. It carries tissue factor pathway inhibitor and releases tissue plasminogen activator. Every one of these keeps blood liquid. This is the resting STOP state of the previous slide.
The lower half shows the same cells once damaged, and their character reverses. The vessel constricts. Von Willebrand factor is released and P-selectin appears to capture platelets. Collagen and tissue factor are exposed, starting the platelet and coagulation arms respectively. And the endothelium now releases plasminogen activator inhibitor and thrombin-activatable fibrinolysis inhibitor to protect the new clot from premature dissolution. ADAMTS13, the enzyme that trims von Willebrand multimers to their working size, belongs to this same traffic.
Hold this picture when you meet acquired bleeding and clotting states later. Sepsis, vasculitis and many drugs injure the endothelium, and an injured endothelium is a procoagulant one.
START: what the platelet does at a wound
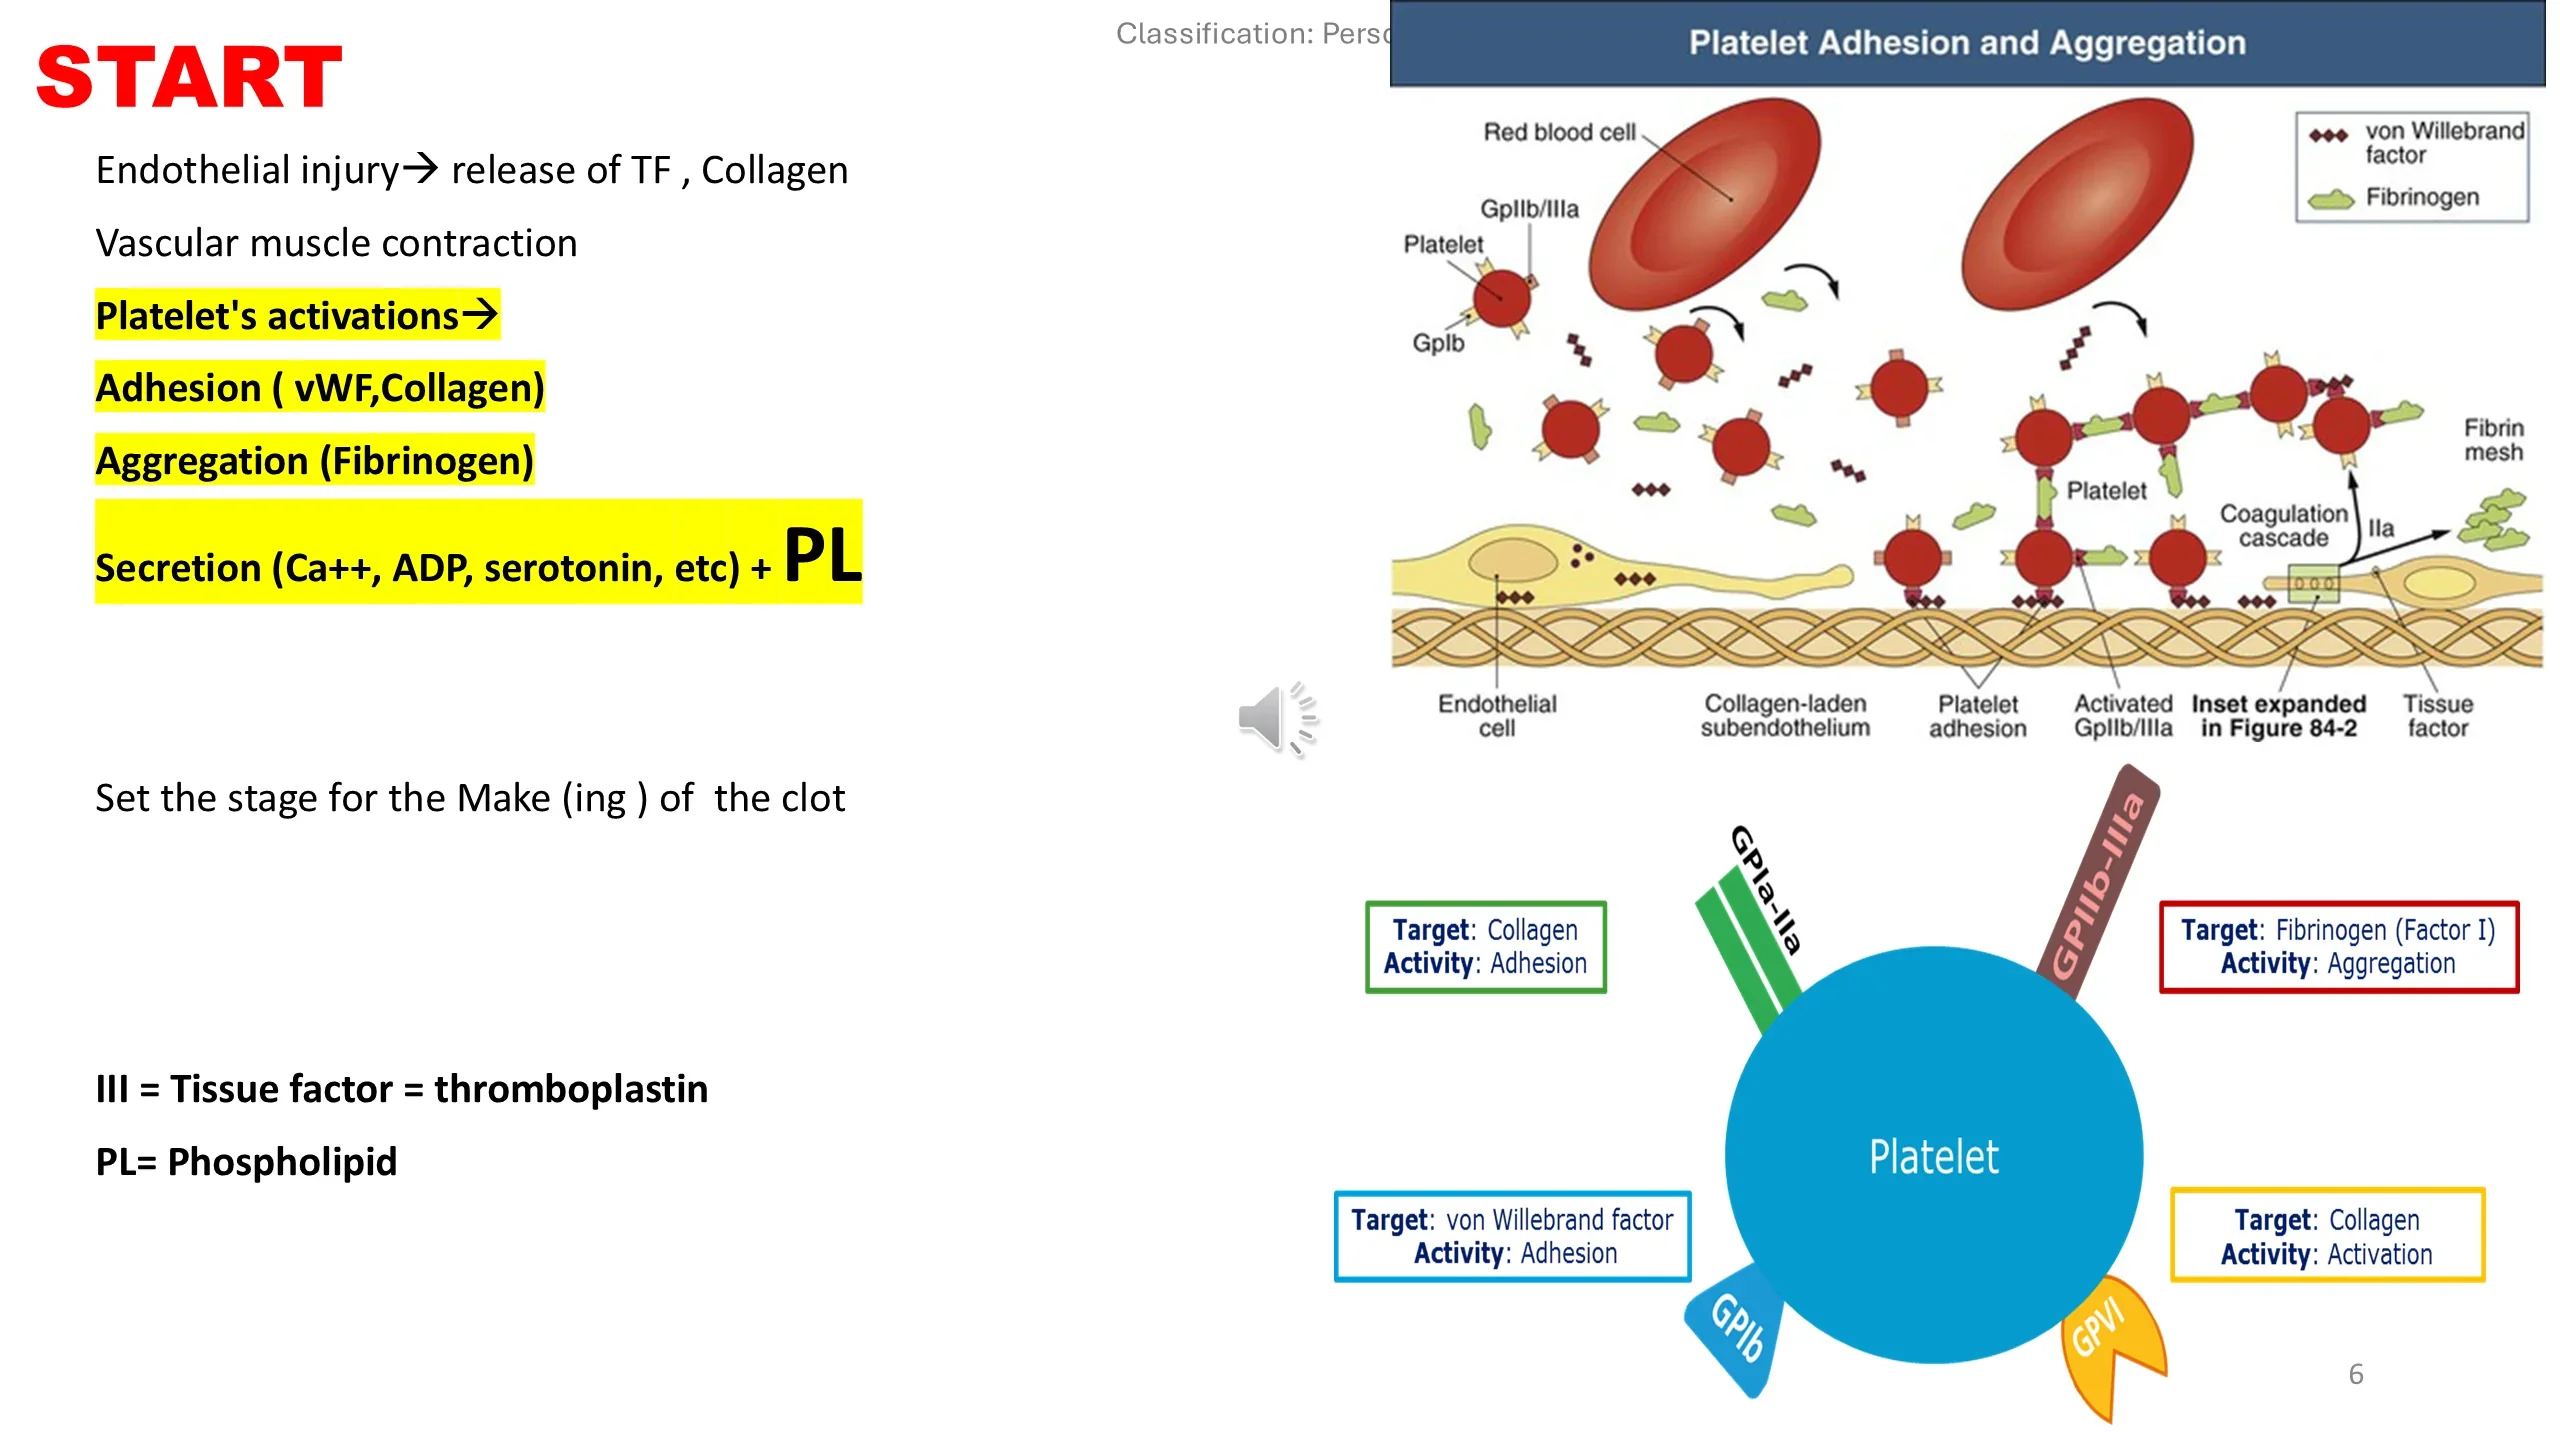
Injury exposes tissue factor, called factor III or thromboplastin in the older nomenclature, and collagen, and the vessel's smooth muscle contracts. The platelet's job then has three parts, and each is mediated by a specific surface receptor listed in the table at the right of the slide.
Adhesion. The platelet sticks to the wound. It binds collagen directly through GPIa-IIa, and, under the high shear of flowing blood, it binds von Willebrand factor that has itself stuck to the collagen, through GPIb. GPVI binds collagen too and delivers the signal that activates the cell. Von Willebrand factor is thus the glue between platelet and wall, which is why its deficiency, von Willebrand disease, is a disorder of primary hemostasis.
Aggregation. Activated platelets bind each other. The receptor GPIIb-IIIa changes shape on activation and binds fibrinogen, factor I, which is a symmetrical molecule and can bridge two platelets at once. The diagram shows the fibrinogen bridges building the aggregate.
Secretion. The activated platelet releases the contents of its granules, calcium, ADP, serotonin and more, which recruit and activate further platelets. And it exposes negatively charged phospholipid on its outer surface. That phospholipid is the platform on which the coagulation factors will assemble in the next stage: the platelet sets the stage for the making of the clot.
The platelet plug, seen three ways
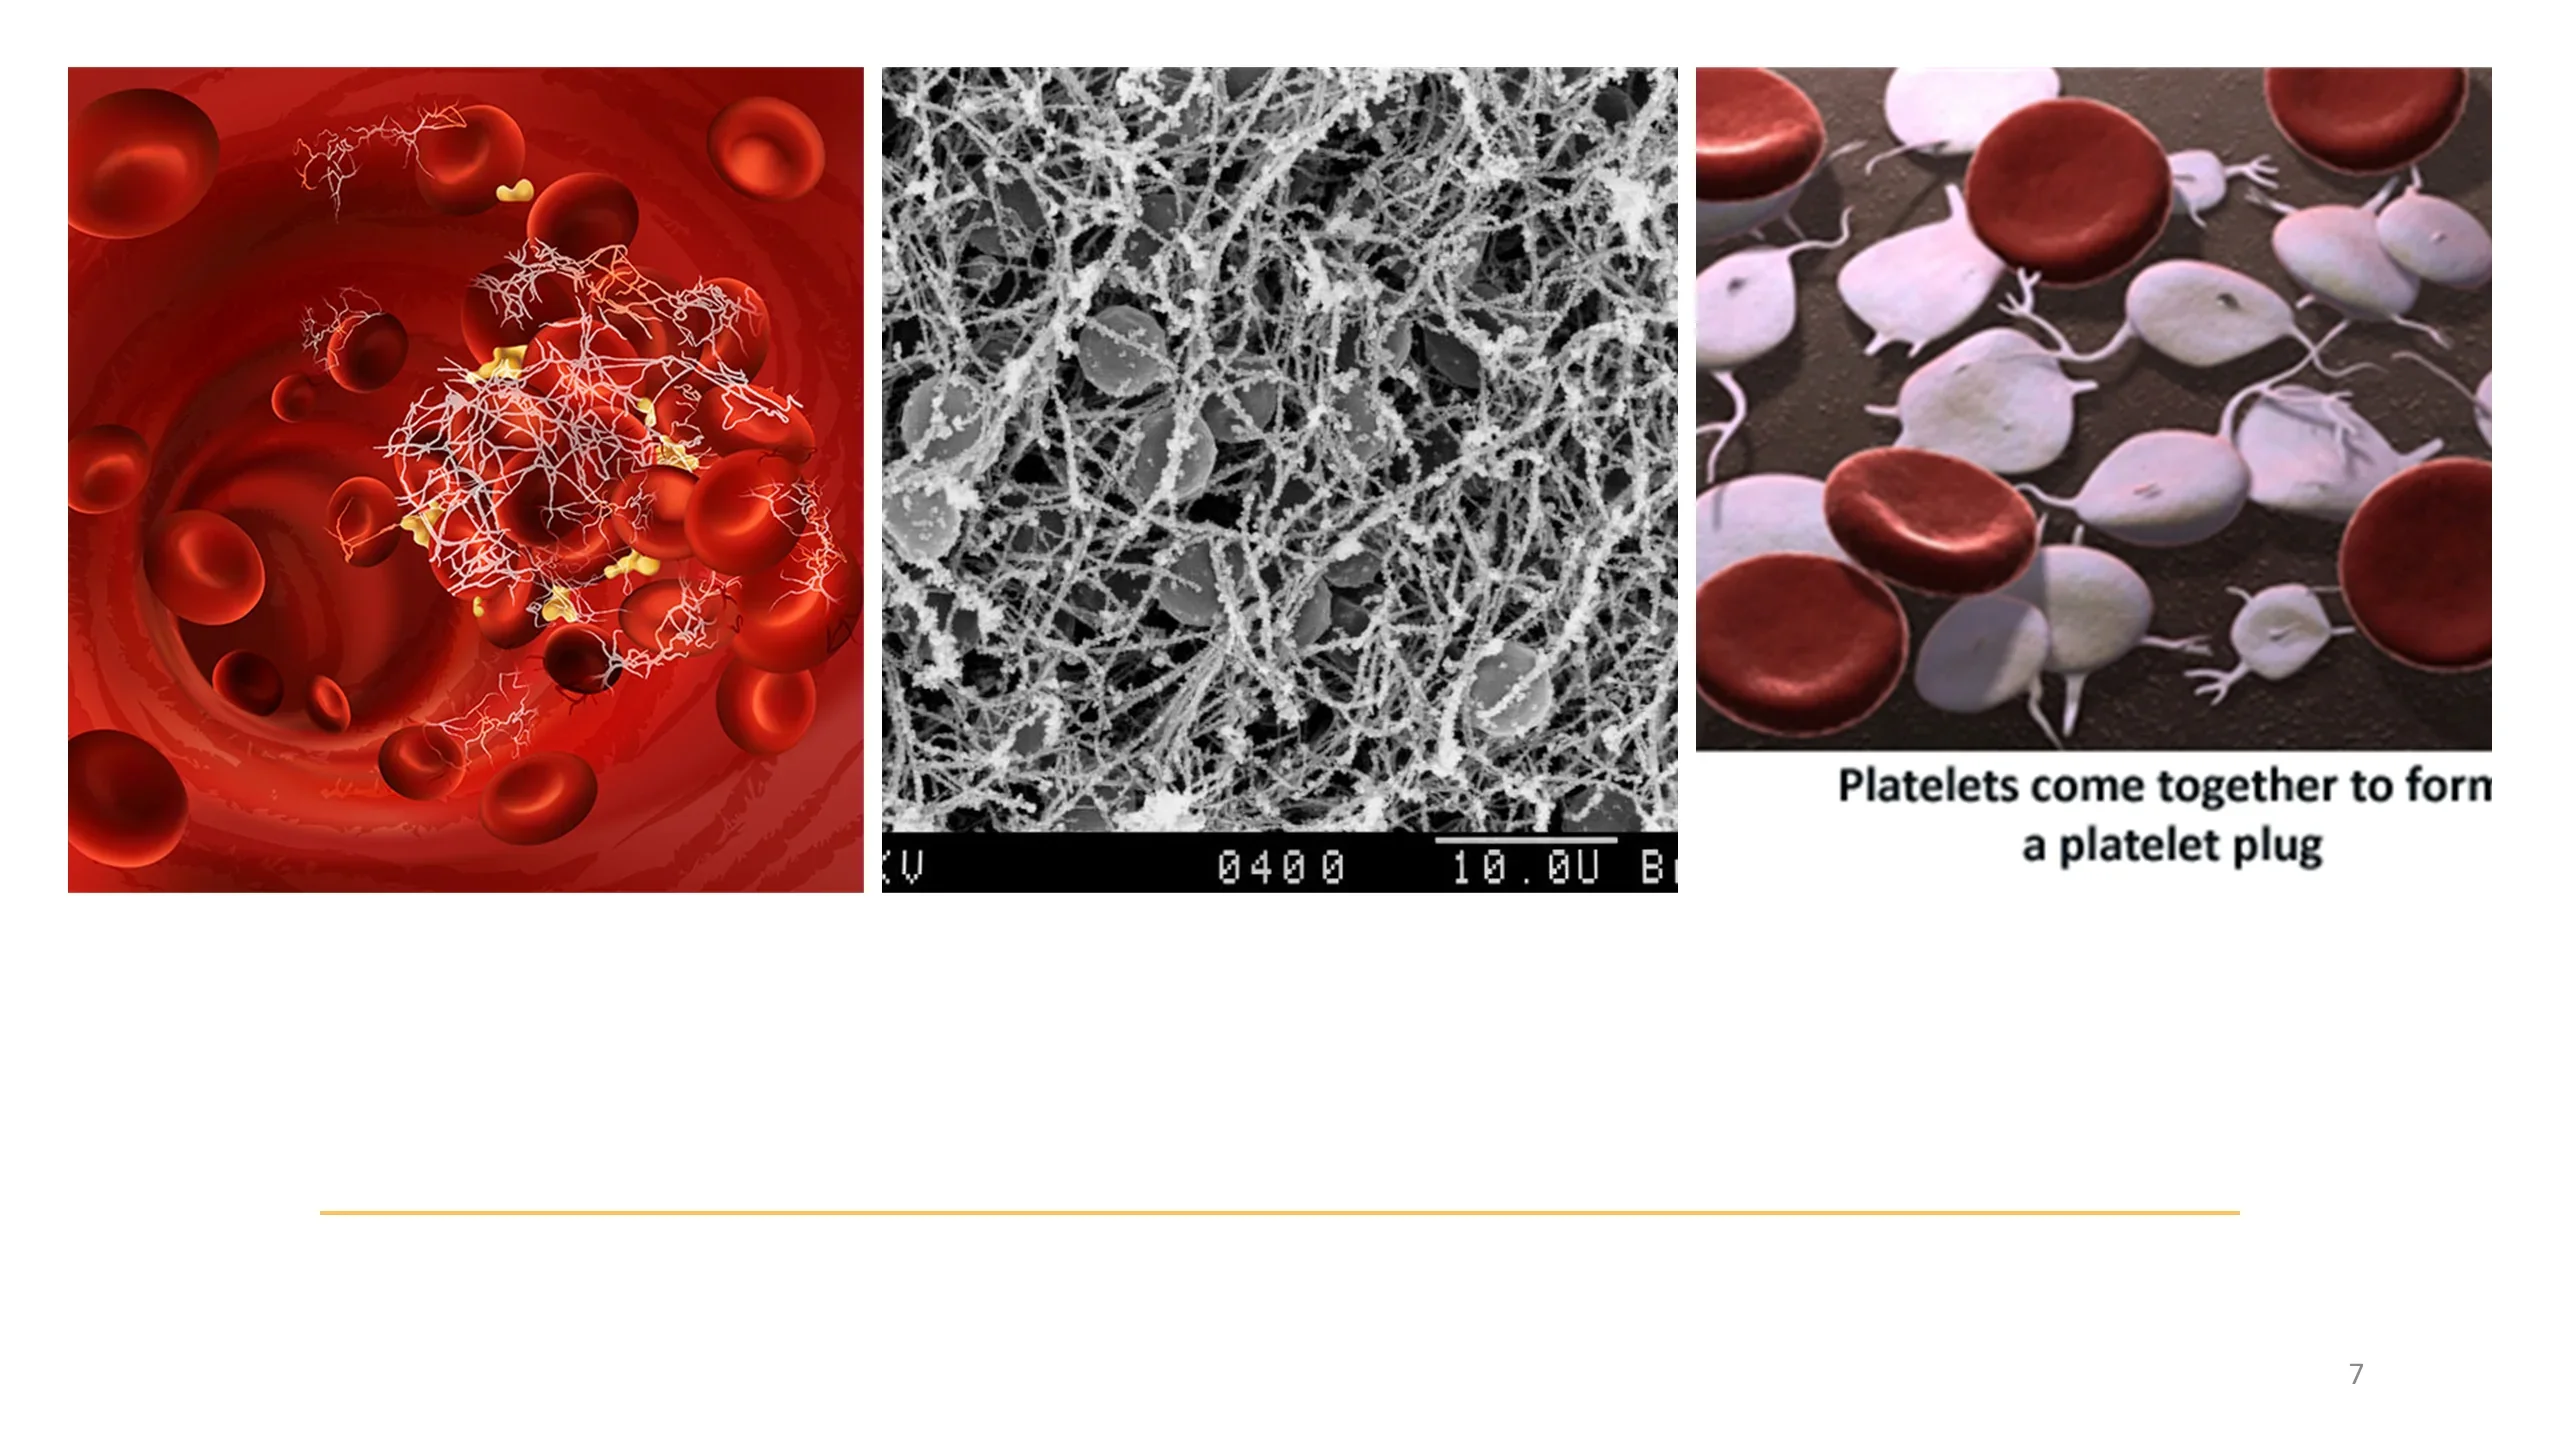
The three images show what the primary plug actually looks like. The illustration shows red cells caught in a developing network of fibrin strands, the moment at which the platelet plug is being converted into a stable clot. The scanning electron micrograph shows the real thing: a fibrin mesh, each strand a polymer of fibrin monomers, entrapping blood cells; the scale bar is ten micrometres, about the diameter of a single red cell. The photomicrograph shows platelets aggregating into the plug itself.
Two points to take from the pictures. First, the plug is porous. A mass of platelets stops bleeding from a capillary, but under arterial pressure it would wash away without fibrin to bind it. Second, fibrin is a mesh, not a wall, and it traps whatever is flowing past, which is why a clot is red. The next slides turn to how that fibrin is made.
See it online.
- A blood clot under the scanning electron microscope: red cells caught in a fibrin mesh Wikimedia Commons · Public domain · Janice Carr, CDC
MAKE the clot, the classical model: the cascade in a Y
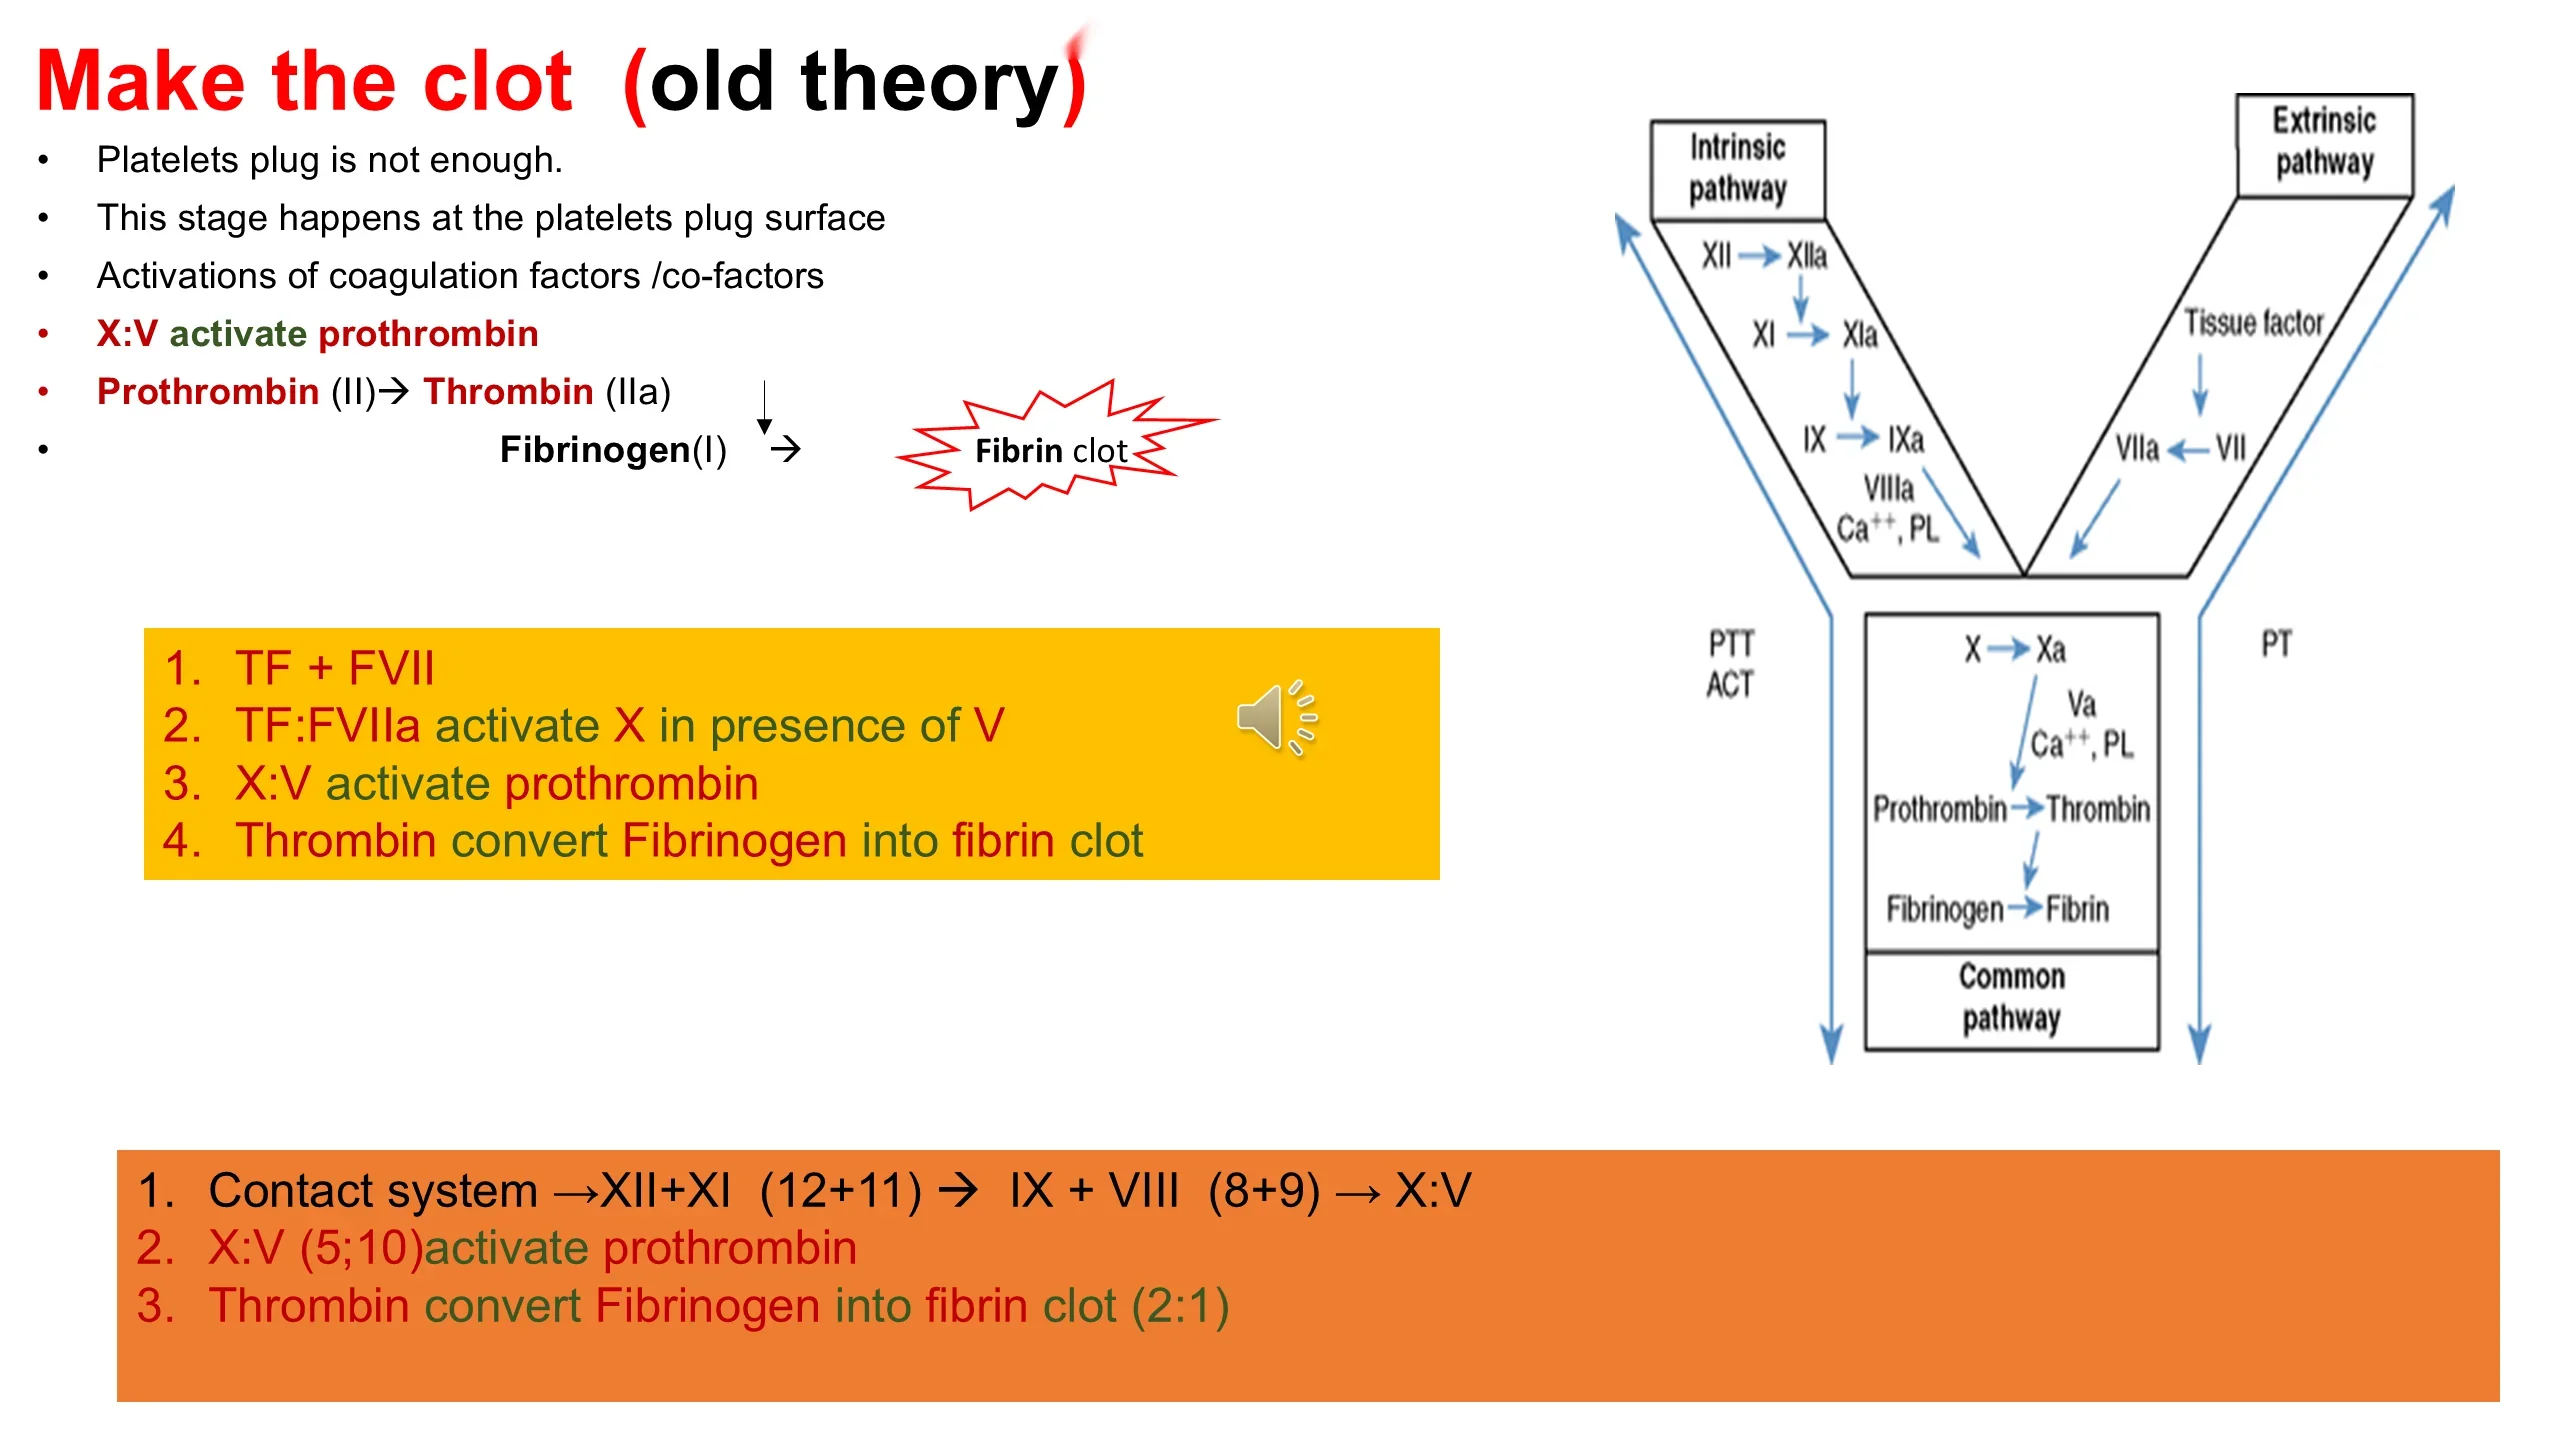
The platelet plug is not enough, so the second stage builds fibrin on its surface. The bullet points give the end of the story in three lines, and they are the lines to memorise: factor X with its cofactor V activates prothrombin; prothrombin, factor II, becomes thrombin, factor IIa; and thrombin converts fibrinogen, factor I, into the fibrin clot.
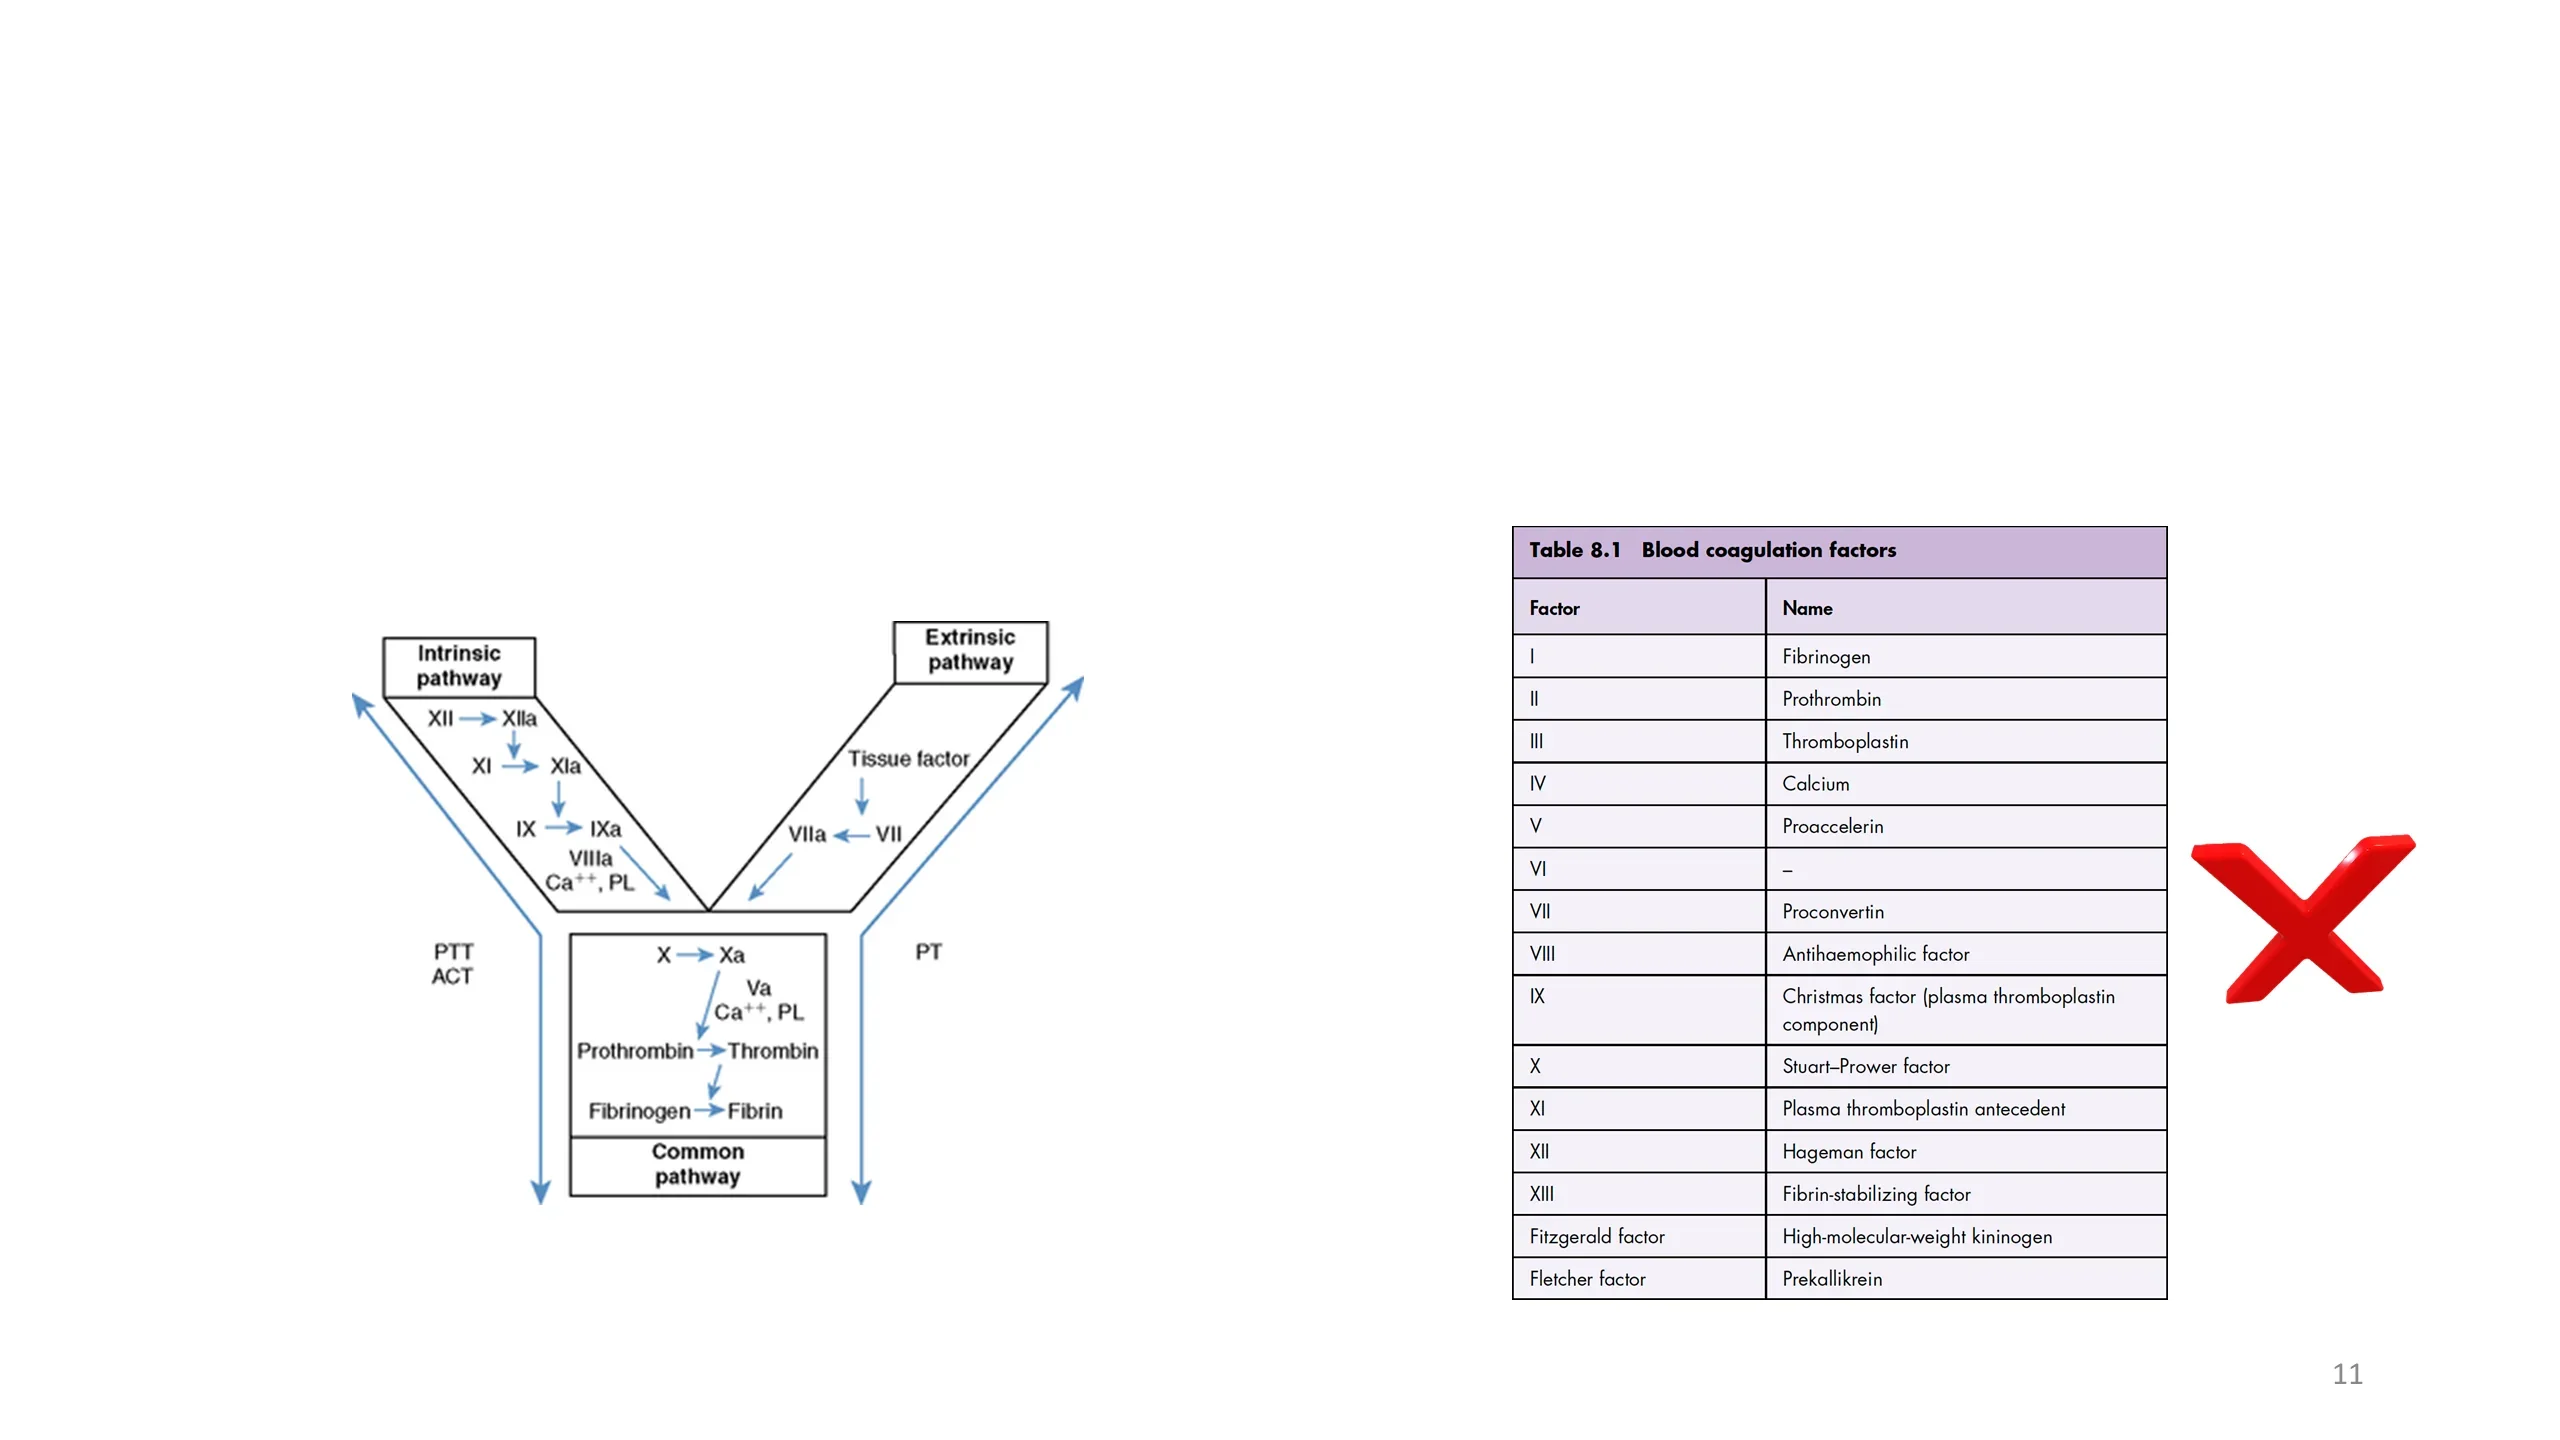
The Y-shaped diagram shows how the classical model reaches that common pathway from two directions. The extrinsic pathway, in the yellow box, is short: tissue factor binds factor VII, the complex activates factor X, and with factor V the prothrombin is activated. The intrinsic pathway, in the orange box, is long: the contact system activates XII, then XI, then IX, which with its cofactor VIII activates X, and the common pathway follows as before. Every step needs calcium and the phospholipid surface the platelet provided.
The model is called old because it describes what happens in a test tube rather than in a patient, and the next slide corrects it. But it is kept for a reason that matters every day on the wards: the two laboratory tests are built on it. The PT measures the extrinsic and common pathways; the PTT measures the intrinsic and common pathways. When you interpret a coagulation screen, this is the diagram you are reading.
MAKE the clot, the cell-based model: a spark and a burst
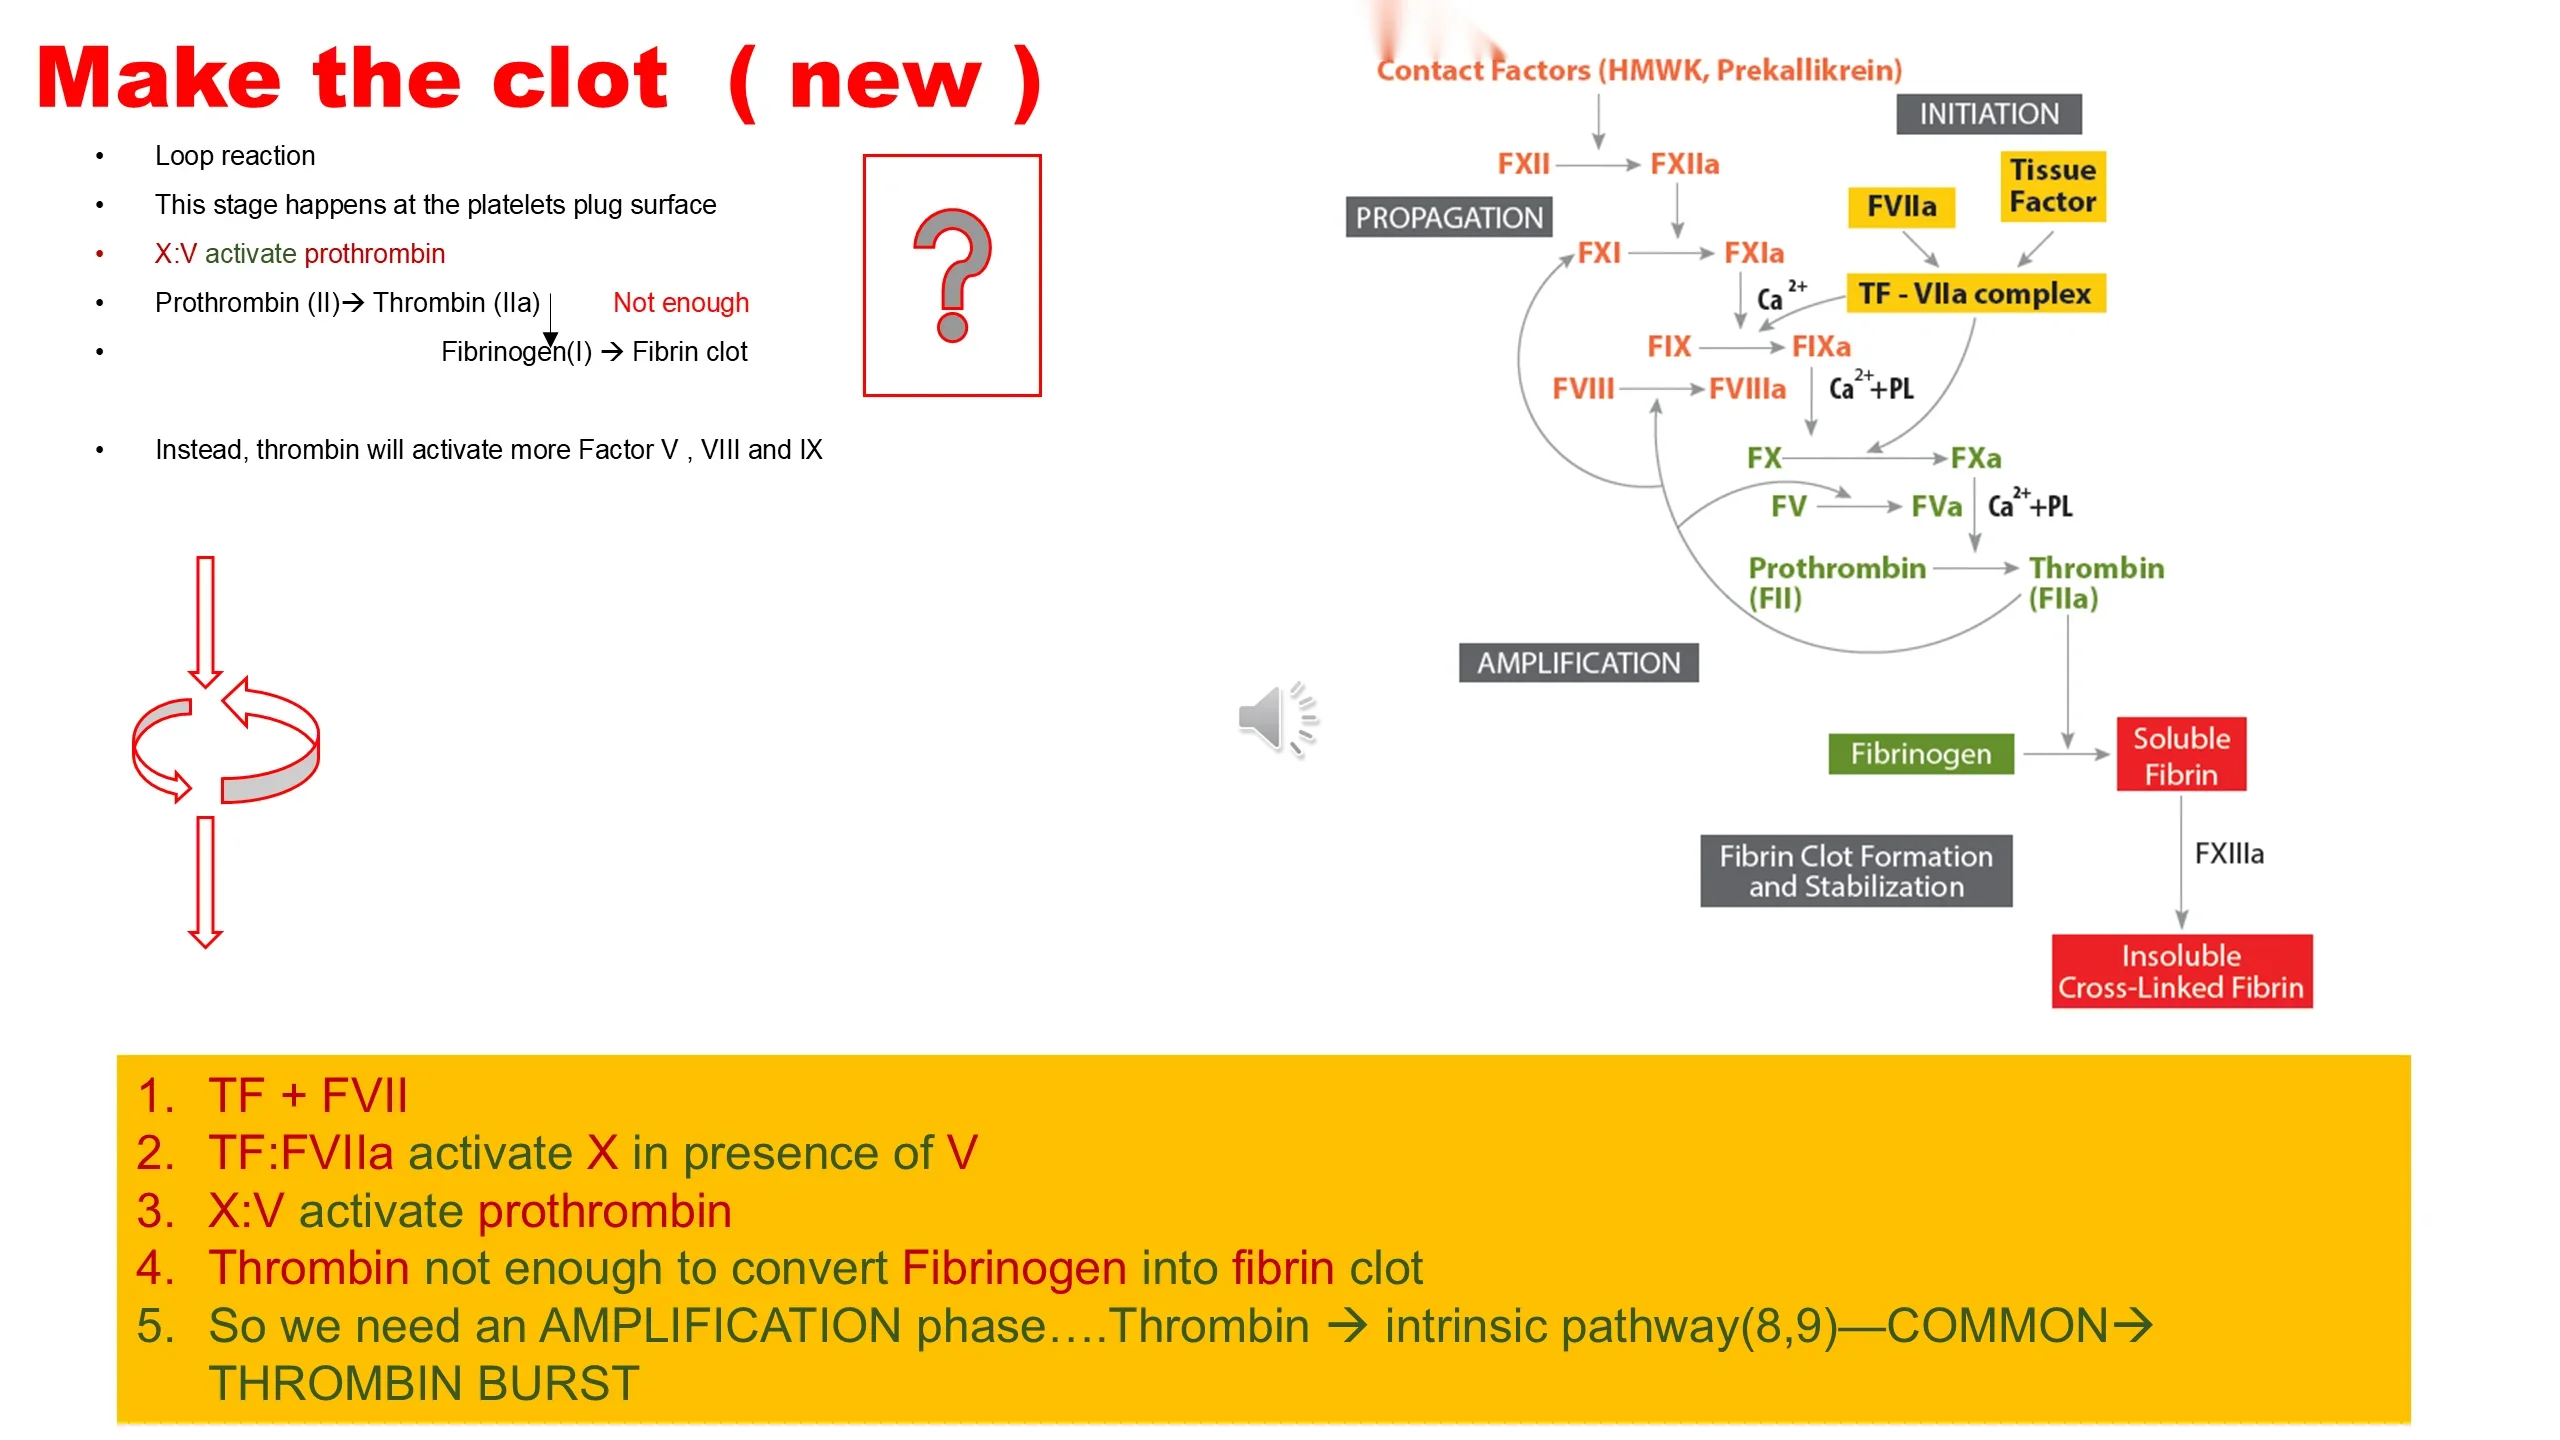
The classical cascade has a problem, marked by the red question mark on the slide. In a real wound, tissue factor and factor VIIa activate factor X and make a little thrombin, but that thrombin is not enough to build a clot. And if the intrinsic pathway were a genuine parallel route, patients lacking factor XII would bleed and patients lacking factor VIII would not. The reverse is true. The modern model resolves this with a loop, the red circular arrow.
The diagram shows three phases. Initiation: tissue factor and VIIa generate a small amount of thrombin, a spark. Amplification: that first thrombin, instead of making fibrin, turns back and activates factors V and VIII, and platelets, and the intrinsic factors IX and XI are recruited on the platelet surface. Propagation: the now fully assembled IXa-VIIIa complex activates factor X at a rate hundreds of times greater than tissue factor could, and the result is a thrombin burst large enough to convert fibrinogen to fibrin and, through factor XIII, to cross-link the soluble fibrin into an insoluble clot.
This model explains the clinic. Hemophilia A and B, deficiencies of VIII and IX, bleed severely because they lack the amplification step even though the initiation step is intact. Factor XII deficiency prolongs the PTT in the tube but causes no bleeding, because in a real wound the loop, not the contact system, drives the intrinsic factors. The old diagram tells you what the tests measure; this one tells you who bleeds.
Coagulation simplified: the numbers to keep in your head
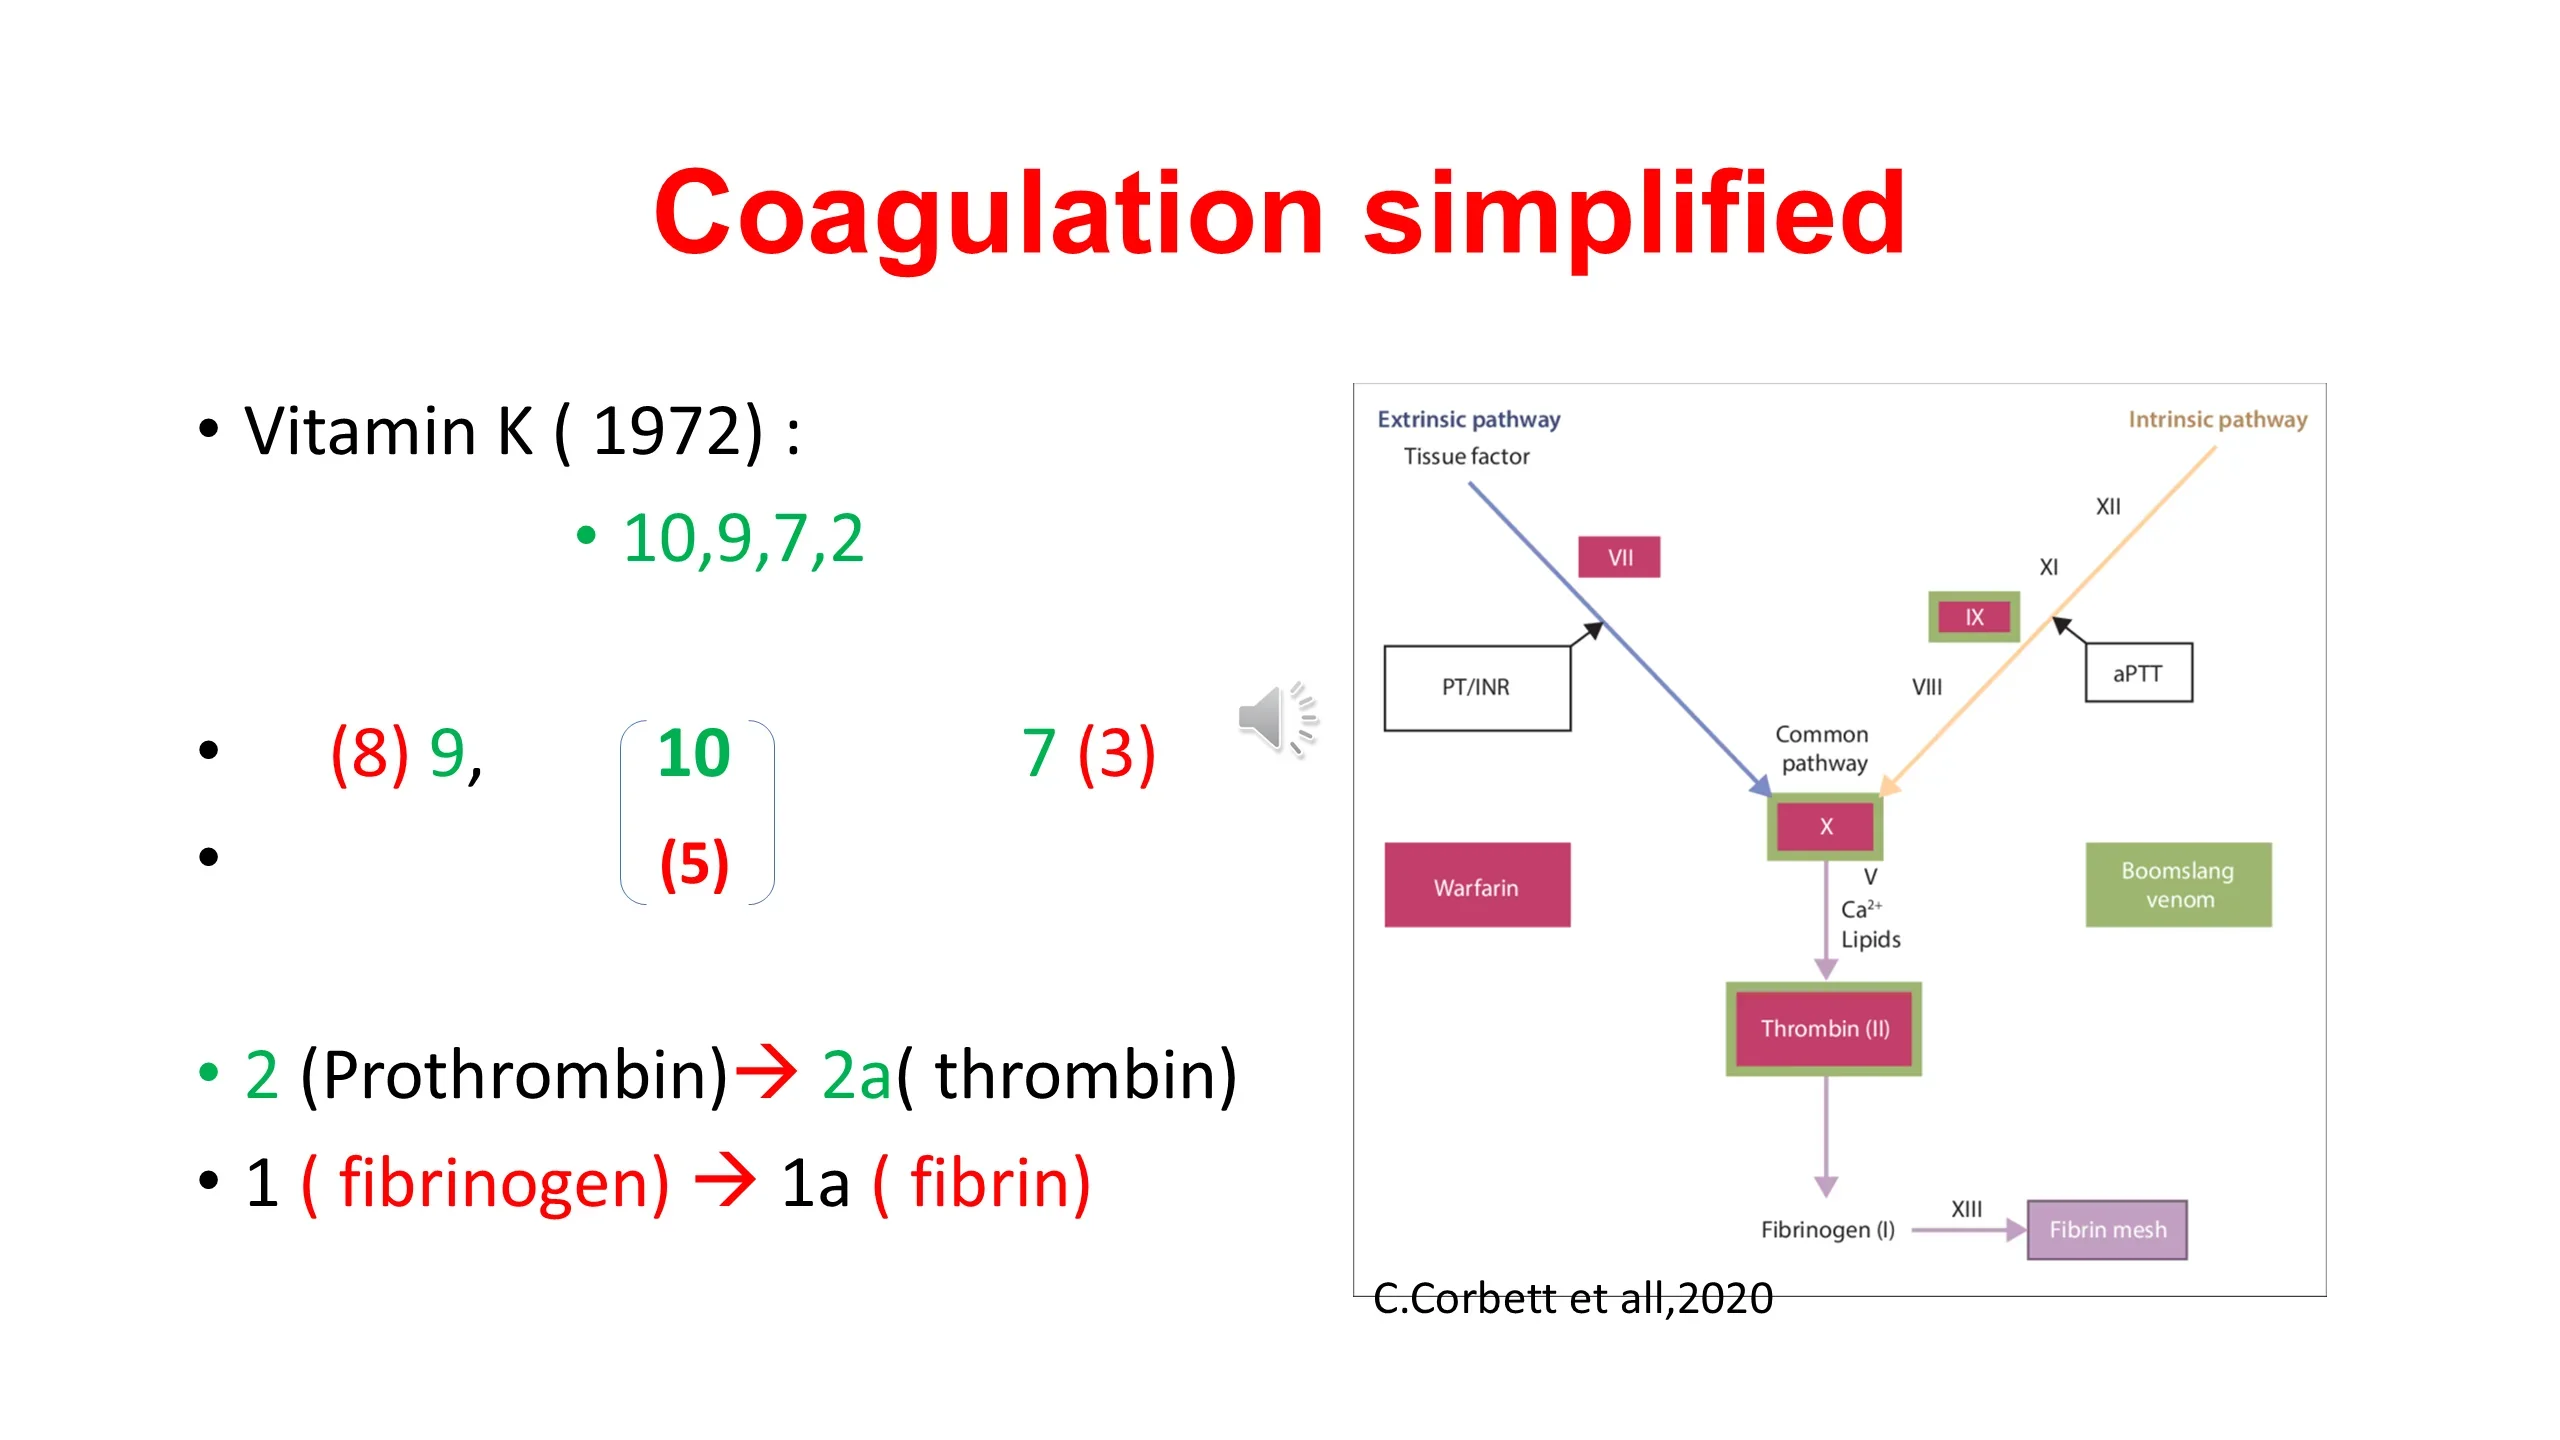
The left of the slide reduces the cascade to a handful of numbers, arranged so that they can be remembered. The vitamin K-dependent factors are 10, 9, 7 and 2, and the mnemonic 1972 keeps them together. These four need vitamin K to be made in an active form, which is why vitamin K deficiency and warfarin, which blocks the vitamin's recycling, cause bleeding, and why the diagram places warfarin on the extrinsic side, where factor VII, the shortest-lived of the four, falls first.
The second line groups the pathways: the intrinsic factors 8 and 9, then 12 and 11 above them; the common pathway 10 with its cofactor 5; the extrinsic factor 7 with tissue factor, factor 3. Then the final common steps, 2 to 2a, prothrombin to thrombin, and 1 to 1a, fibrinogen to fibrin.
The coloured diagram from Corbett and colleagues repeats the map with its clinical annotations. The extrinsic arm is measured by the PT, reported as the INR for patients on warfarin. The intrinsic arm is measured by the aPTT. Factor XIII stabilises the mesh at the very end. The venom of the boomslang, marked at factor X, is an aside worth a smile: several snake venoms are potent activators of individual coagulation factors and have been used as laboratory reagents to study them.
The factor table, and the red cross beside it
The cascade is drawn once more on the left, and beside it Table 8.1 lists every coagulation factor by Roman numeral and by its historical name: fibrinogen, prothrombin, thromboplastin, calcium, proaccelerin, proconvertin, antihemophilic factor, Christmas factor, Stuart-Prower factor, plasma thromboplastin antecedent, Hageman factor, fibrin-stabilising factor, and the two contact proteins named after patients, Fitzgerald factor and Fletcher factor. Factor VI is blank: it was assigned and then withdrawn when it proved to be activated factor V.
The large red cross is the lecturer's instruction about this table: do not memorise it. The names are the debris of the history of discovery, each one given when a factor was found in a patient or a laboratory before its place in the sequence was known. What you need to know are the numbers, their positions in the cascade, and the few names that survive in clinical speech: fibrinogen, prothrombin, tissue factor, and the hemophilia factors VIII and IX. The rest is here for reference, not for the examination.
STOP: the natural anticoagulants that keep the clot local
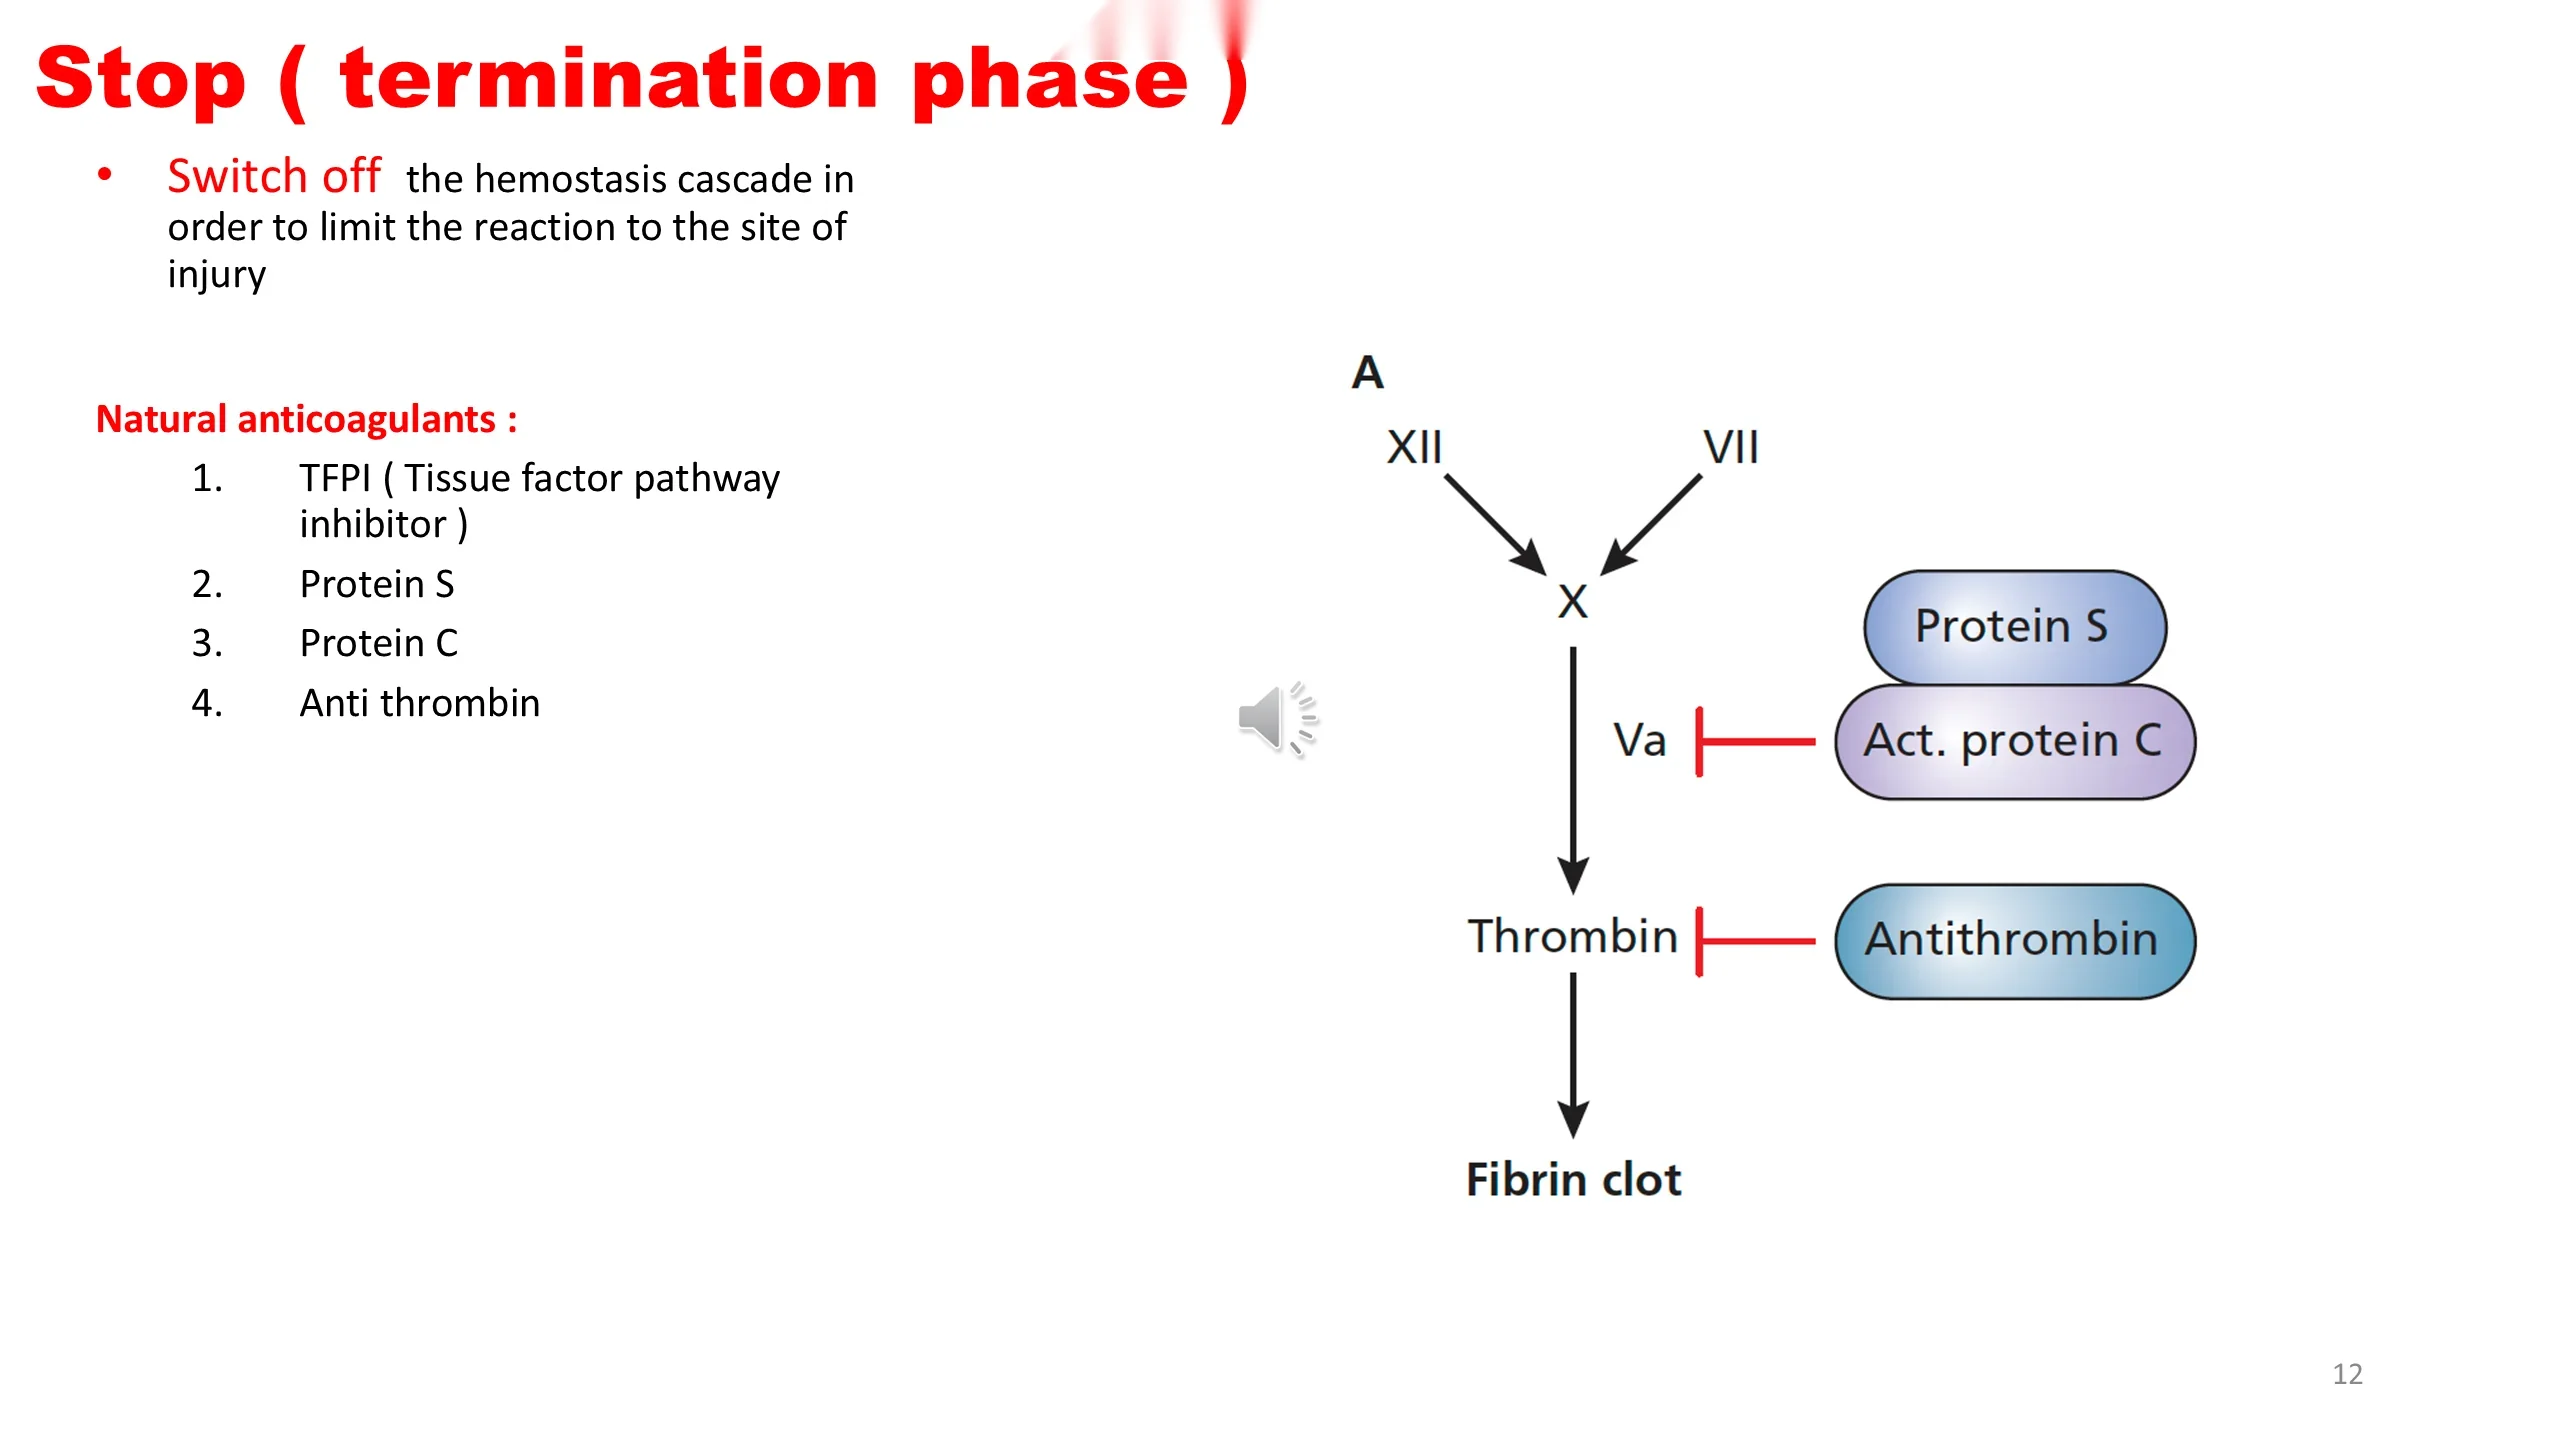
A coagulation cascade that amplifies itself would, left alone, clot the entire circulation. The termination phase exists to switch it off, and to confine the reaction to the site of injury. Four natural anticoagulants do this, and each acts at a specific point on diagram A.
Tissue factor pathway inhibitor shuts down the initiation step by inhibiting the tissue factor-VIIa complex once a little factor Xa has formed. Antithrombin inactivates thrombin itself, and factor Xa, and its action is accelerated enormously by heparin, which is how heparin works as a drug. Protein C, activated by thrombin bound to thrombomodulin on healthy endothelium, and its cofactor protein S together destroy the two cofactors of the cascade, factor Va and factor VIIIa, which switches off the amplification loop of slide 8.
Notice the elegance of the protein C system: thrombin that reaches intact endothelium is converted from a procoagulant into an anticoagulant signal, so the clot cannot grow beyond the wound. Deficiencies of these proteins tip the balance of slide 2 toward thrombosis, and they will reappear in the thrombosis seminar as the hereditary thrombophilias.
CLEAN: fibrinolysis removes the clot once the vessel has healed
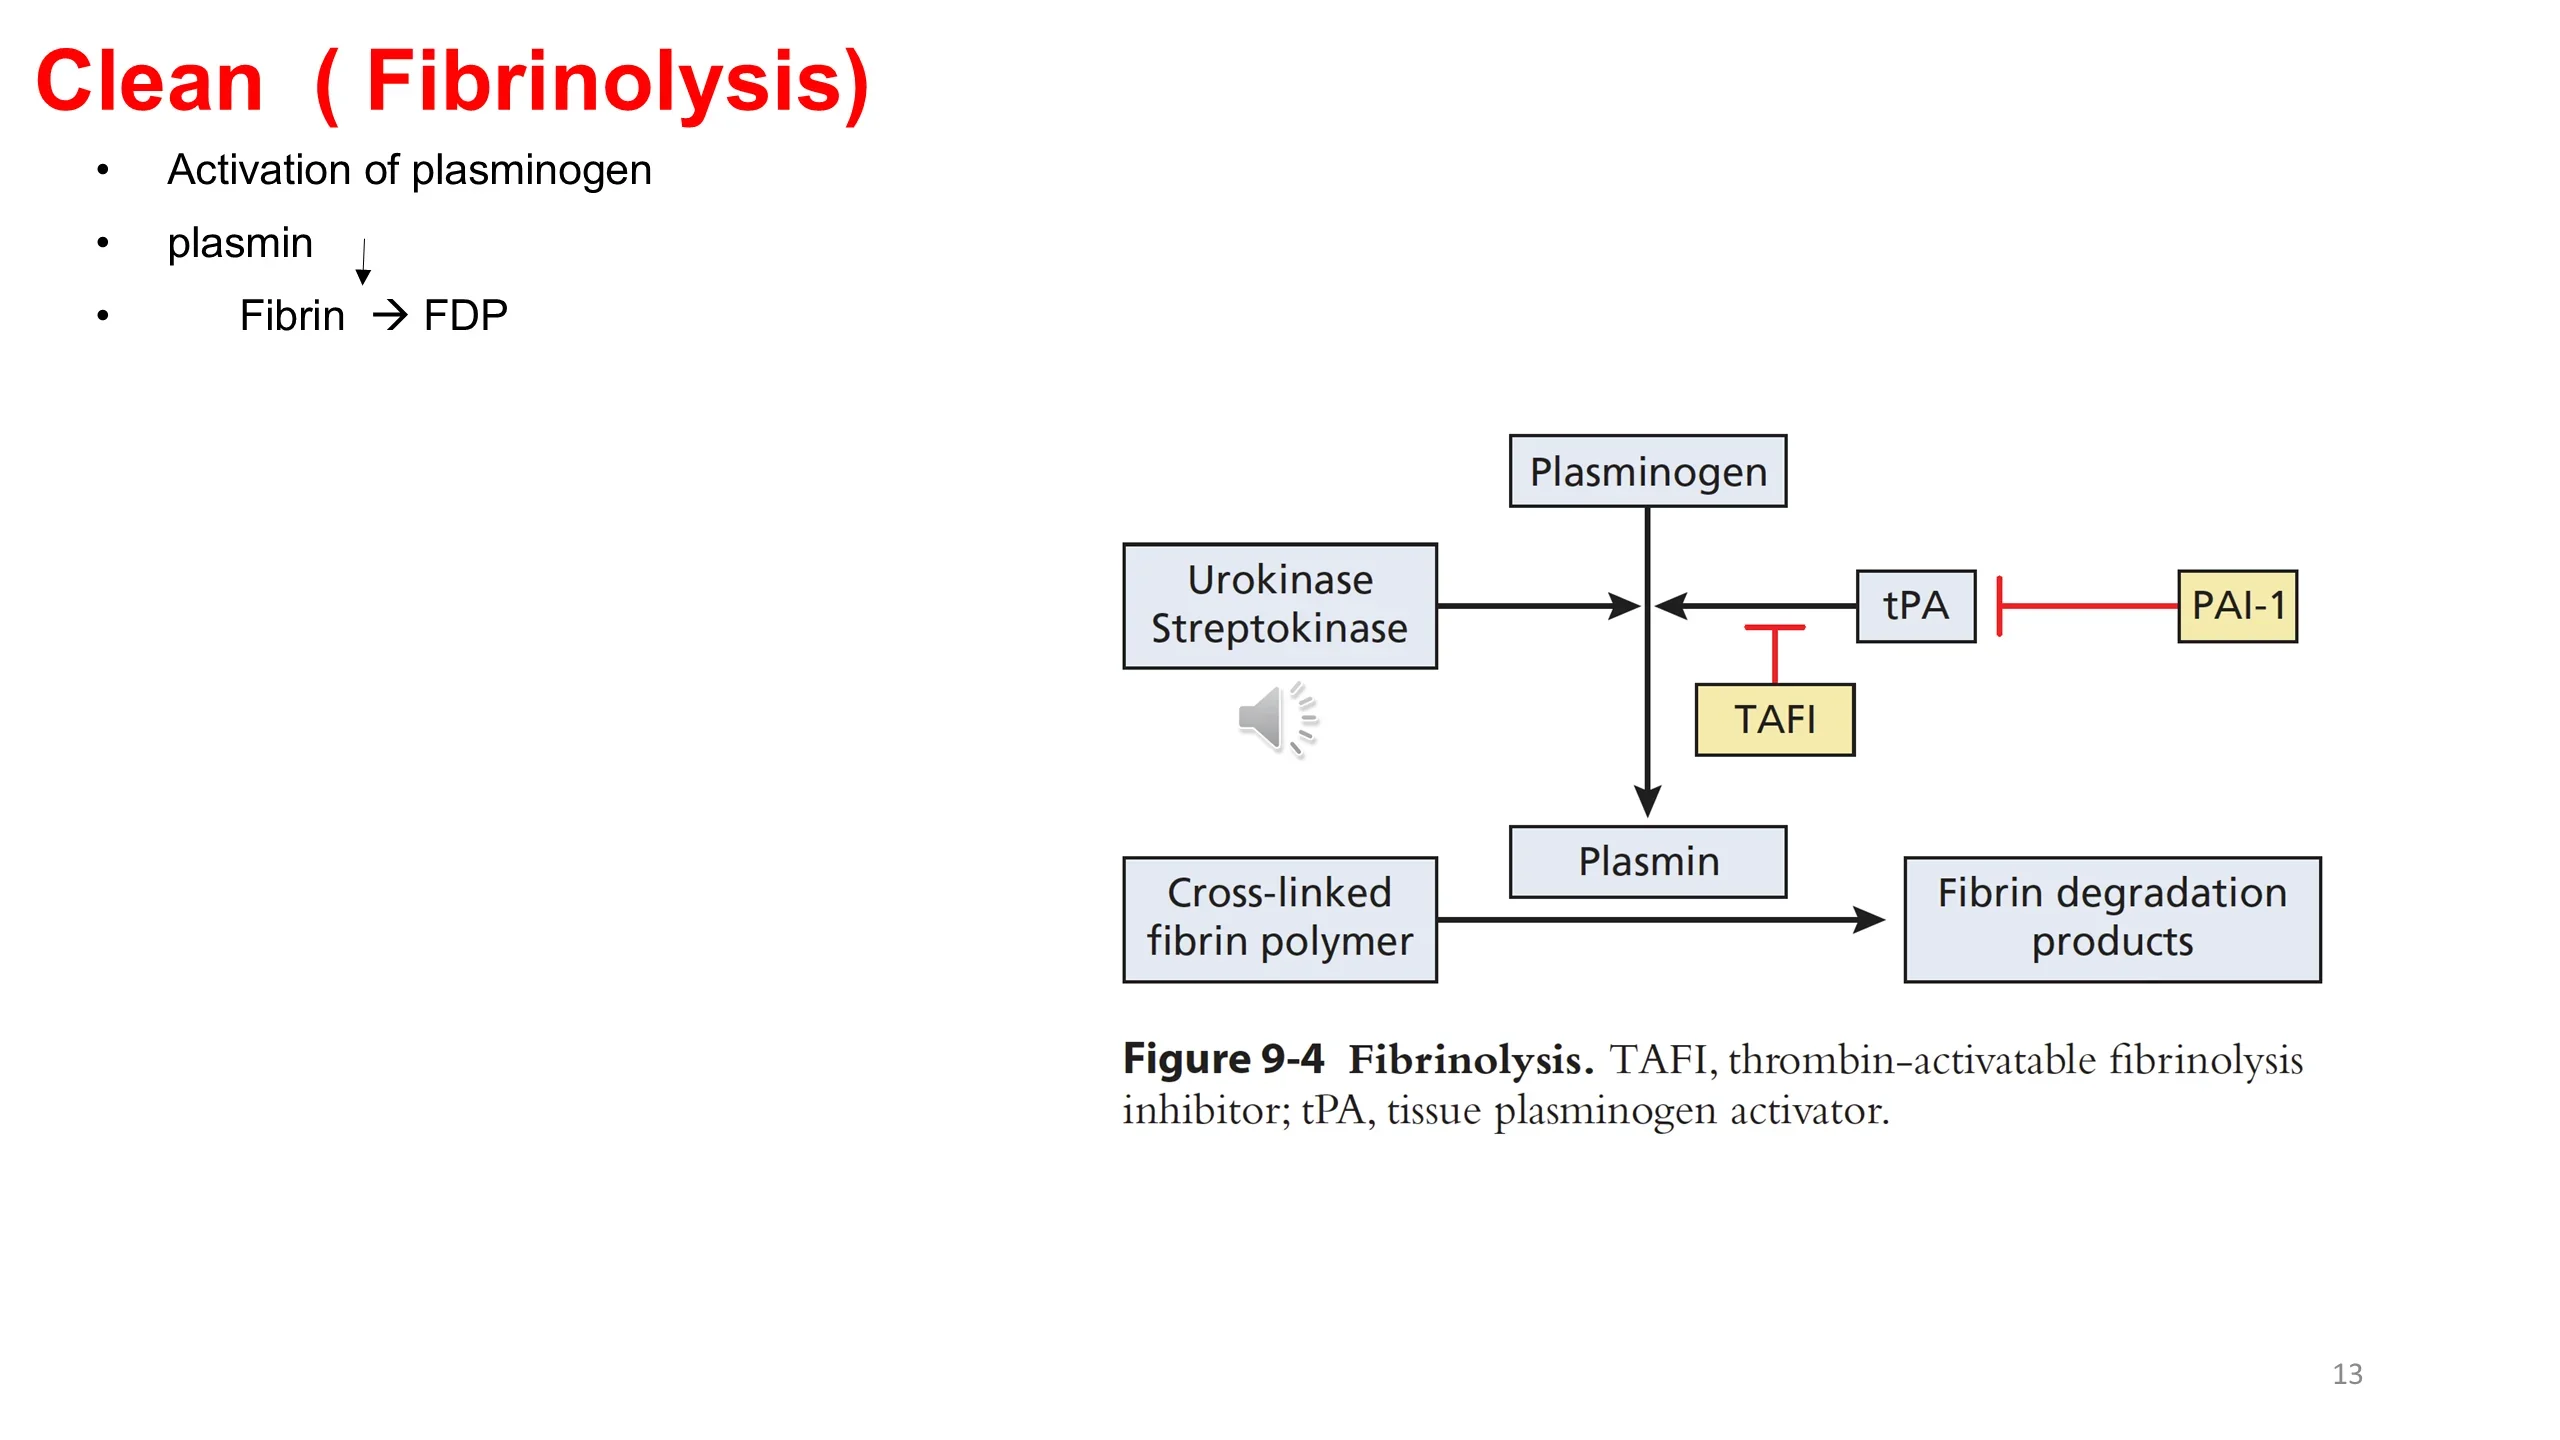
A clot is a temporary repair. Once the vessel wall has healed the clot must be removed, and the system that removes it is fibrinolysis. Its logic mirrors coagulation: an inactive precursor, plasminogen, is converted to an active enzyme, plasmin, which digests cross-linked fibrin into fibrin degradation products.
Figure 9-4 shows the activators and the brakes. The physiological activator is tissue plasminogen activator, released by the endothelium, and the drugs used to dissolve clots in stroke and myocardial infarction are recombinant versions of it or, in the case of urokinase and streptokinase, other activators of the same step. The brakes are plasminogen activator inhibitor-1, which blocks the activator, and thrombin-activatable fibrinolysis inhibitor, which is switched on by the clotting process itself to protect a fresh clot from being dissolved before it has done its work.
Fibrinolysis has two clinical faces. Too little, and clots persist. Too much, as in some cancers and in the later stages of disseminated intravascular coagulation, and the patient bleeds because clots dissolve as fast as they form. The measurement that tells you fibrinolysis has happened is the subject of the final slide.
Fibrin from fibrinogen, and D-dimer from fibrin
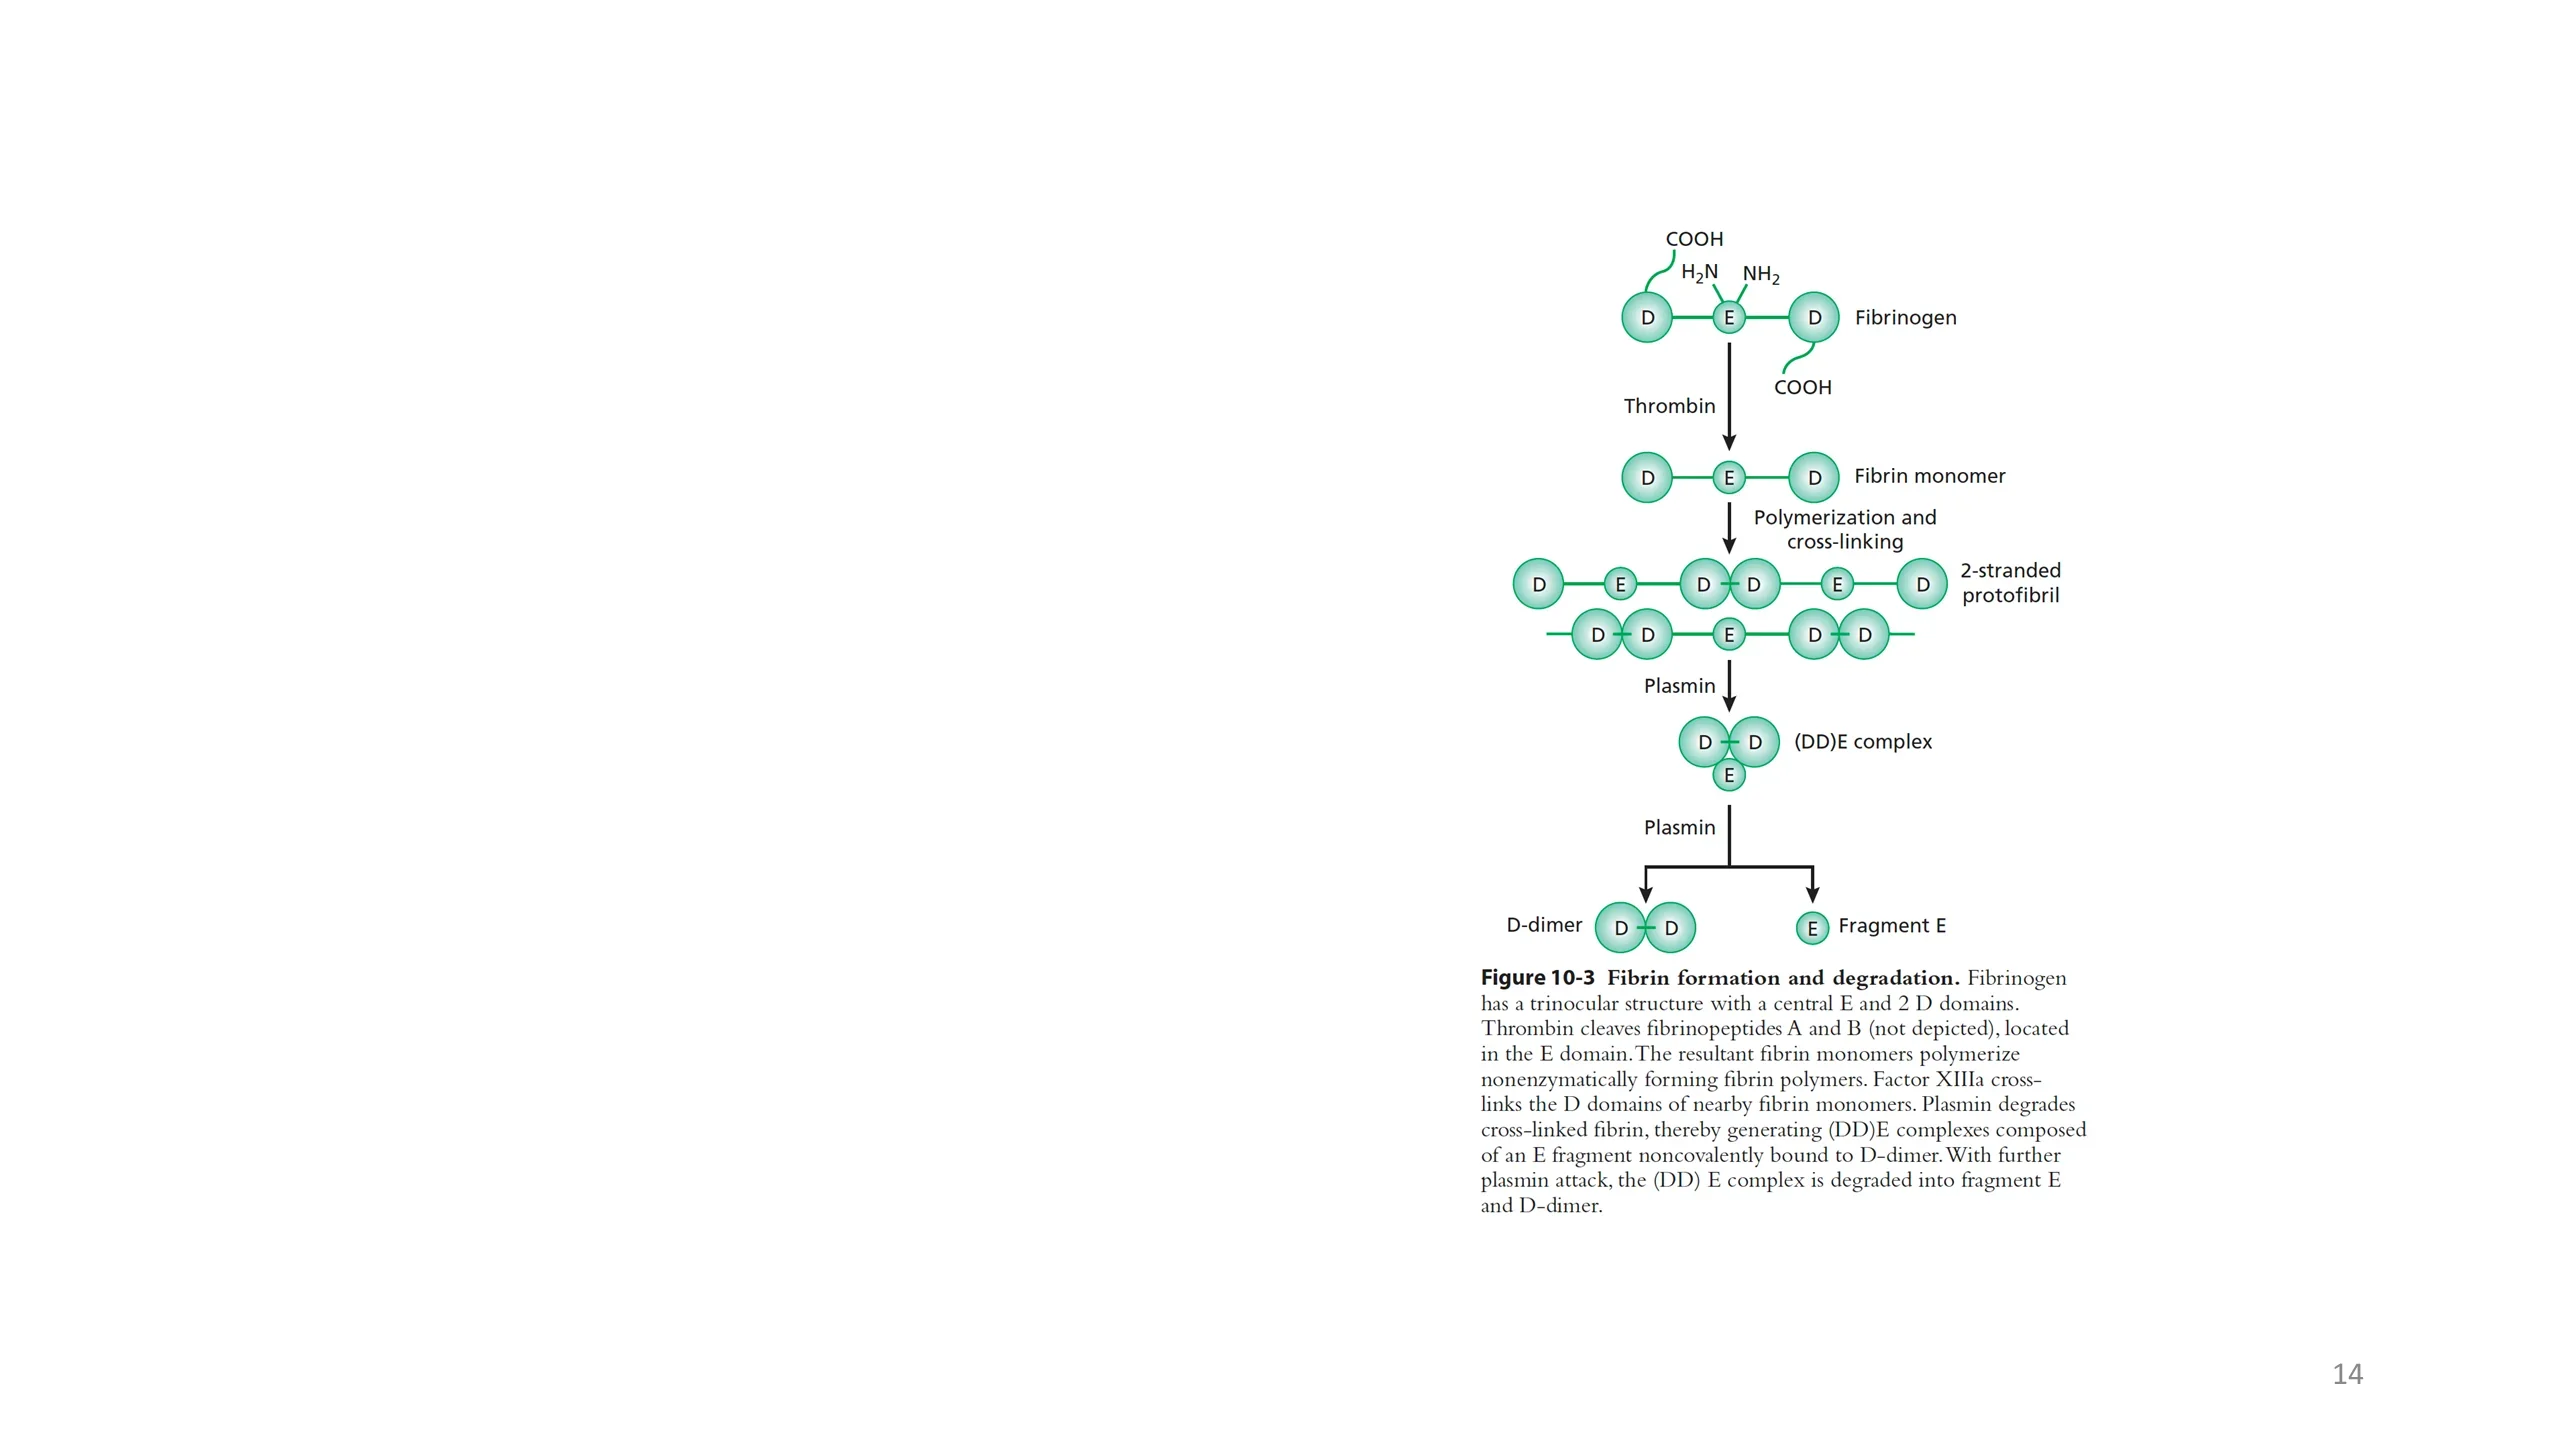
Figure 10-3 follows a single fibrinogen molecule through its life, and it explains what the D-dimer test actually measures. Fibrinogen has three nodes: a central E domain flanked by two D domains. Thrombin cleaves small fibrinopeptides from the E domain, and the exposed sites let the resulting fibrin monomers line up spontaneously, each E domain nestling between the D domains of its neighbours, to form a two-stranded protofibril. This polymer is held together only by weak bonds until factor XIIIa forms covalent cross-links between adjacent D domains, making the fibrin insoluble.
When plasmin attacks the cross-linked polymer it cuts between the domains, but it cannot cut the covalent bond that XIIIa made. So the fragments it releases contain two D domains still joined: first a (DD)E complex, and with further digestion a free D-dimer and a fragment E.
This is why the D-dimer is such a specific marker. A D-dimer can exist only if fibrin was formed, cross-linked by factor XIIIa, and then broken down by plasmin. Its presence proves that a clot formed and was being dissolved, which is why it is used to exclude venous thromboembolism and to recognise disseminated intravascular coagulation. Its weakness is the mirror of its strength: any clot anywhere, after surgery, in infection, in pregnancy, raises it, so a positive result is common and a negative result is the informative one.
The photograph on the left of the slide shows what fibrin looks like under the light microscope. The pale threads are fibrin strands, each one built from monomers like those in the figure, lined up side by side. The small dark dots caught in the tangle are platelets, and the red cells lie around it. This clump did not form at a wound. It formed in the sample tube, because the blood began to clot after a poor collection. It is here only to show what fibrin strands look like.
Read next. In the casebook, Case 51 · The Microangiopathies and Disseminated Intravascular Coagulation puts the D-dimer to work. In disseminated intravascular coagulation, clots form throughout the circulation, plasmin breaks them down, and the fragments are measured as D-dimer. The case sets that pattern beside TTP and HUS in one table.
See it online.
- Fibrin strands and platelets on a blood film Wikimedia Commons · CC BY-SA 4.0 · Spicy